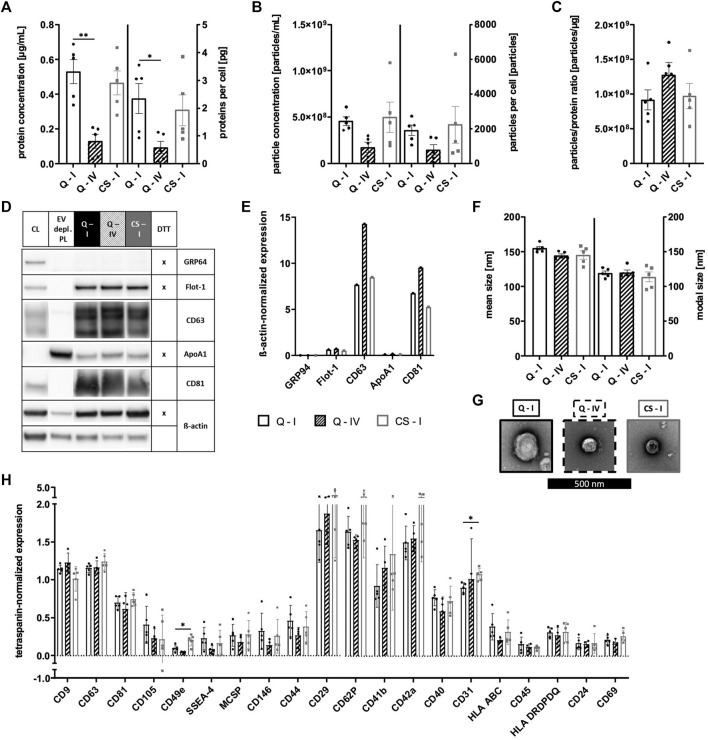
FIGURE 10.
Quantification and characterization of sEVs from Quantum- and CellSTACK-based MSC expansion. sEVs were collected in CM for Quantum- (Q) and CellSTACK-based expansion (CS), respectively. sEVs were isolated from CM by method I for both expansion systems (Q—I; black and CS—I; gray) in addition to method IV for Quantum-derived CM (Q—IV; black with stripes). (A) Protein concentration of sEVs and proteins per cell were quantified by BCA assay. (B) Particle concentration and particles per cell were analyzed by NTA. (C) Particles to protein ratio was calculated for information on purity of isolated sEVs. (D) Western blotting was performed in order to investigate the expression of proteins GRP94, Flot-1, CD63, ApoA1, and CD81. MSC cell lysate (CL) and EV depl. PL served as controls for primary antibodies, and ß-actin was used as loading control. Reducing conditions for indicated proteins were obtained by the addition of dithiothreitol (DTT). (E) Chemiluminescent signal intensities were quantified and normalized on ß-actin intensities, resulting in ß-actin-normalized expression of proteins. (F) Mean and modal size of sEVs was determined by NTA. (G) sEVs were visualized by negative contrast staining using TEM with 60,000 times magnification. The black scale bar represents 500 nm. (H) The expression of several surface antigens by sEVs was analyzed using MACSPlex technology. sEVs were bound by capture beads with epitopes against each analyzed surface antigen and detected indirectly by an APC-coupled detection reagent directed against the tetraspanins CD9, CD63, and CD81. Due to the indirect detection, fluorescence intensity of each surface antigen was normalized on mean fluorescence intensity of CD9, CD63, and CD81, resulting in tetraspanin-normalized expression. Representative images are depicted for western blotting and TEM. Data are presented as mean ± SD, and N ≥ 4 independent experiments were performed for BCA assay, NTA and MACSPlex analyses. Statistically significant differences are depicted as follows: *: p < 0.05, **: p < 0.01.

