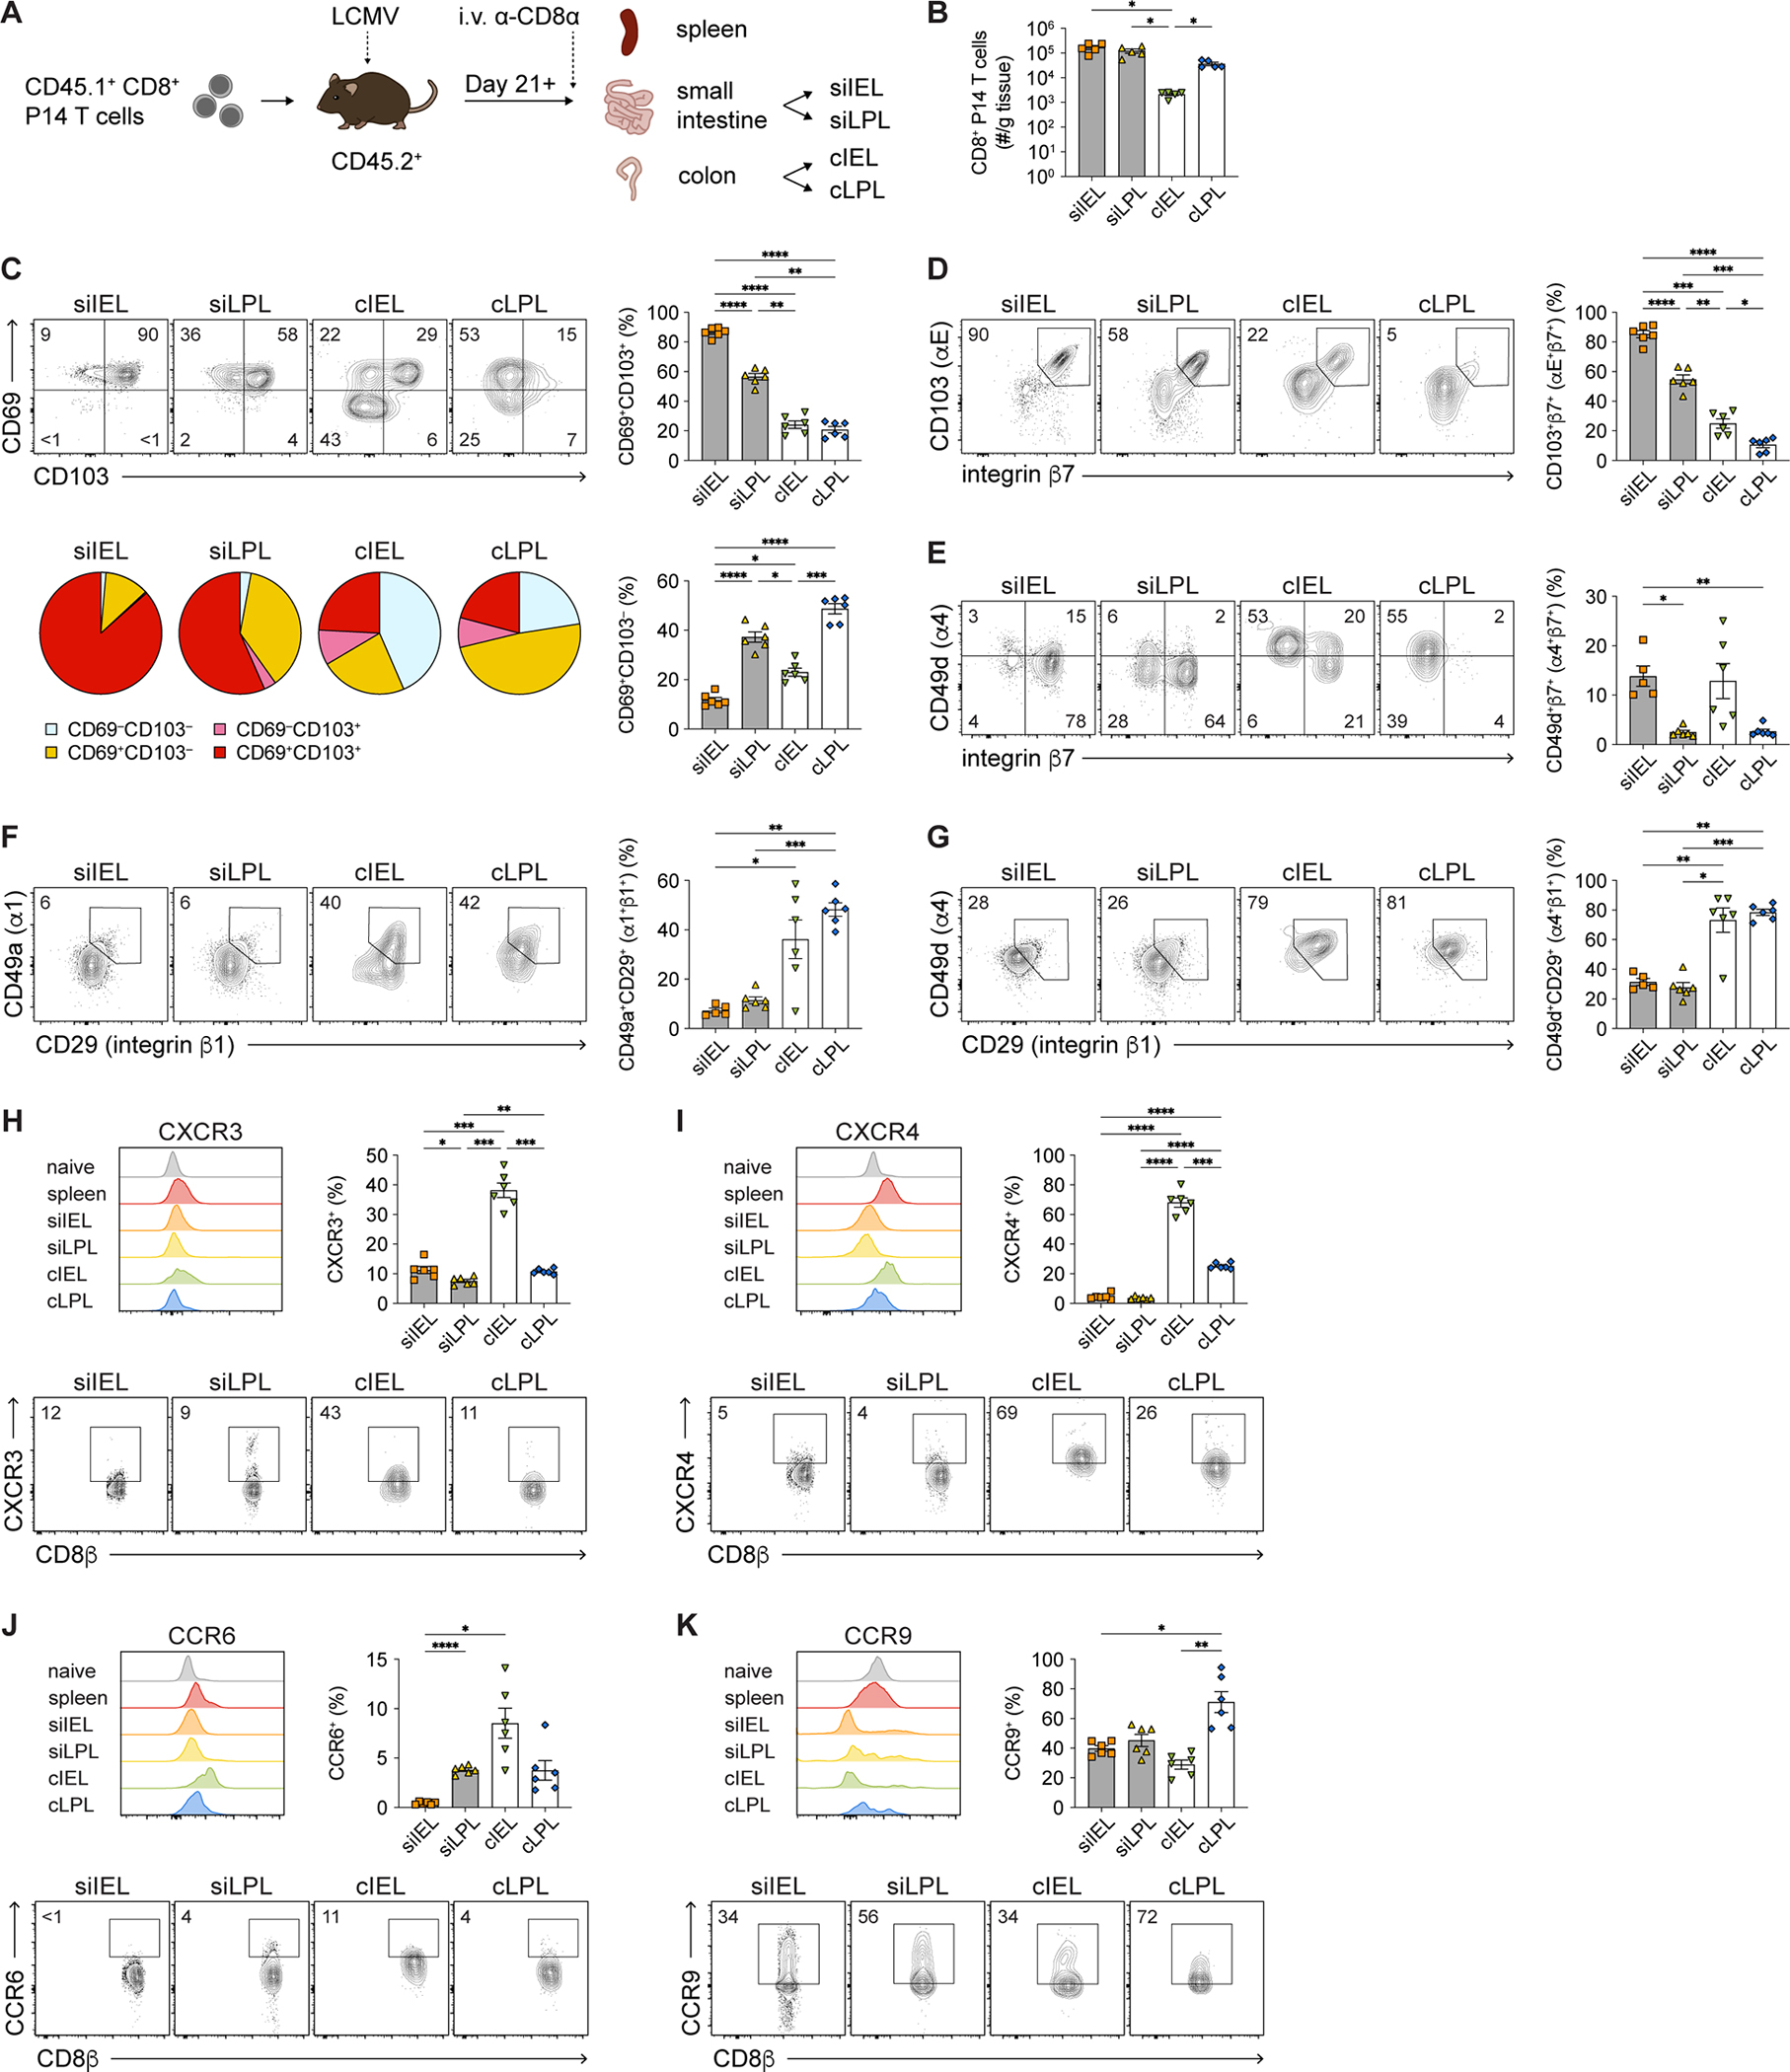
Figure 1. CD8+ TRM cells in SI and colon express distinct levels of CD69 and CD103.

(A) Experimental design. Spleen and intestinal tissue compartments were isolated from CD45.2+ recipient mice ≥ 21 days after LCMV infection following adoptive transfer of donor CD8+CD45.1+ P14 T cells.
(B) Numbers of i.v.− intestinal P14 T cells, normalized to organ weights.
(C) Representative flow cytometry plots showing CD69 and CD103 expression (top left) by i.v.− intestinal P14 T cells. Frequencies (right) of intestinal CD69+CD103+ and CD69+CD103− P14 T cells. Distribution of intestinal P14 T cells expressing CD69 and/or CD103 (bottom left).
(D–G) Representative flow cytometry plots showing expression of CD103/integrin β7 (D), CD49d/integrin β7 (E), CD49a/CD29 (F), CD49d/CD29 (G) among i.v.− intestinal P14 T cells (left). Quantification of indicated integrin heterodimer expression among P14 T cells (right).
(H–K) Representative flow cytometry plots (bottom) showing expression of CXCR3 (H), CXCR4 (I), CCR6 (J), and CCR9 (K) among i.v.− intestinal P14 T cells. Frequencies of cells expressing each molecule (top right) and representative histograms (top left) indicating the distribution of expression for each molecule; expression by naïve (CD62LhiCD44lo) CD8+ T cells from a separate uninfected mouse is shown for comparison. Data are represented as mean ± SEM. Repeated measures one-way ANOVA. *p<0.05, **p<0.01, ***p<0.001 ****p<0.0001.
Data are representative of ≥3 independent experiments with n=5–6 mice per experiment.
See also Figure S1.
