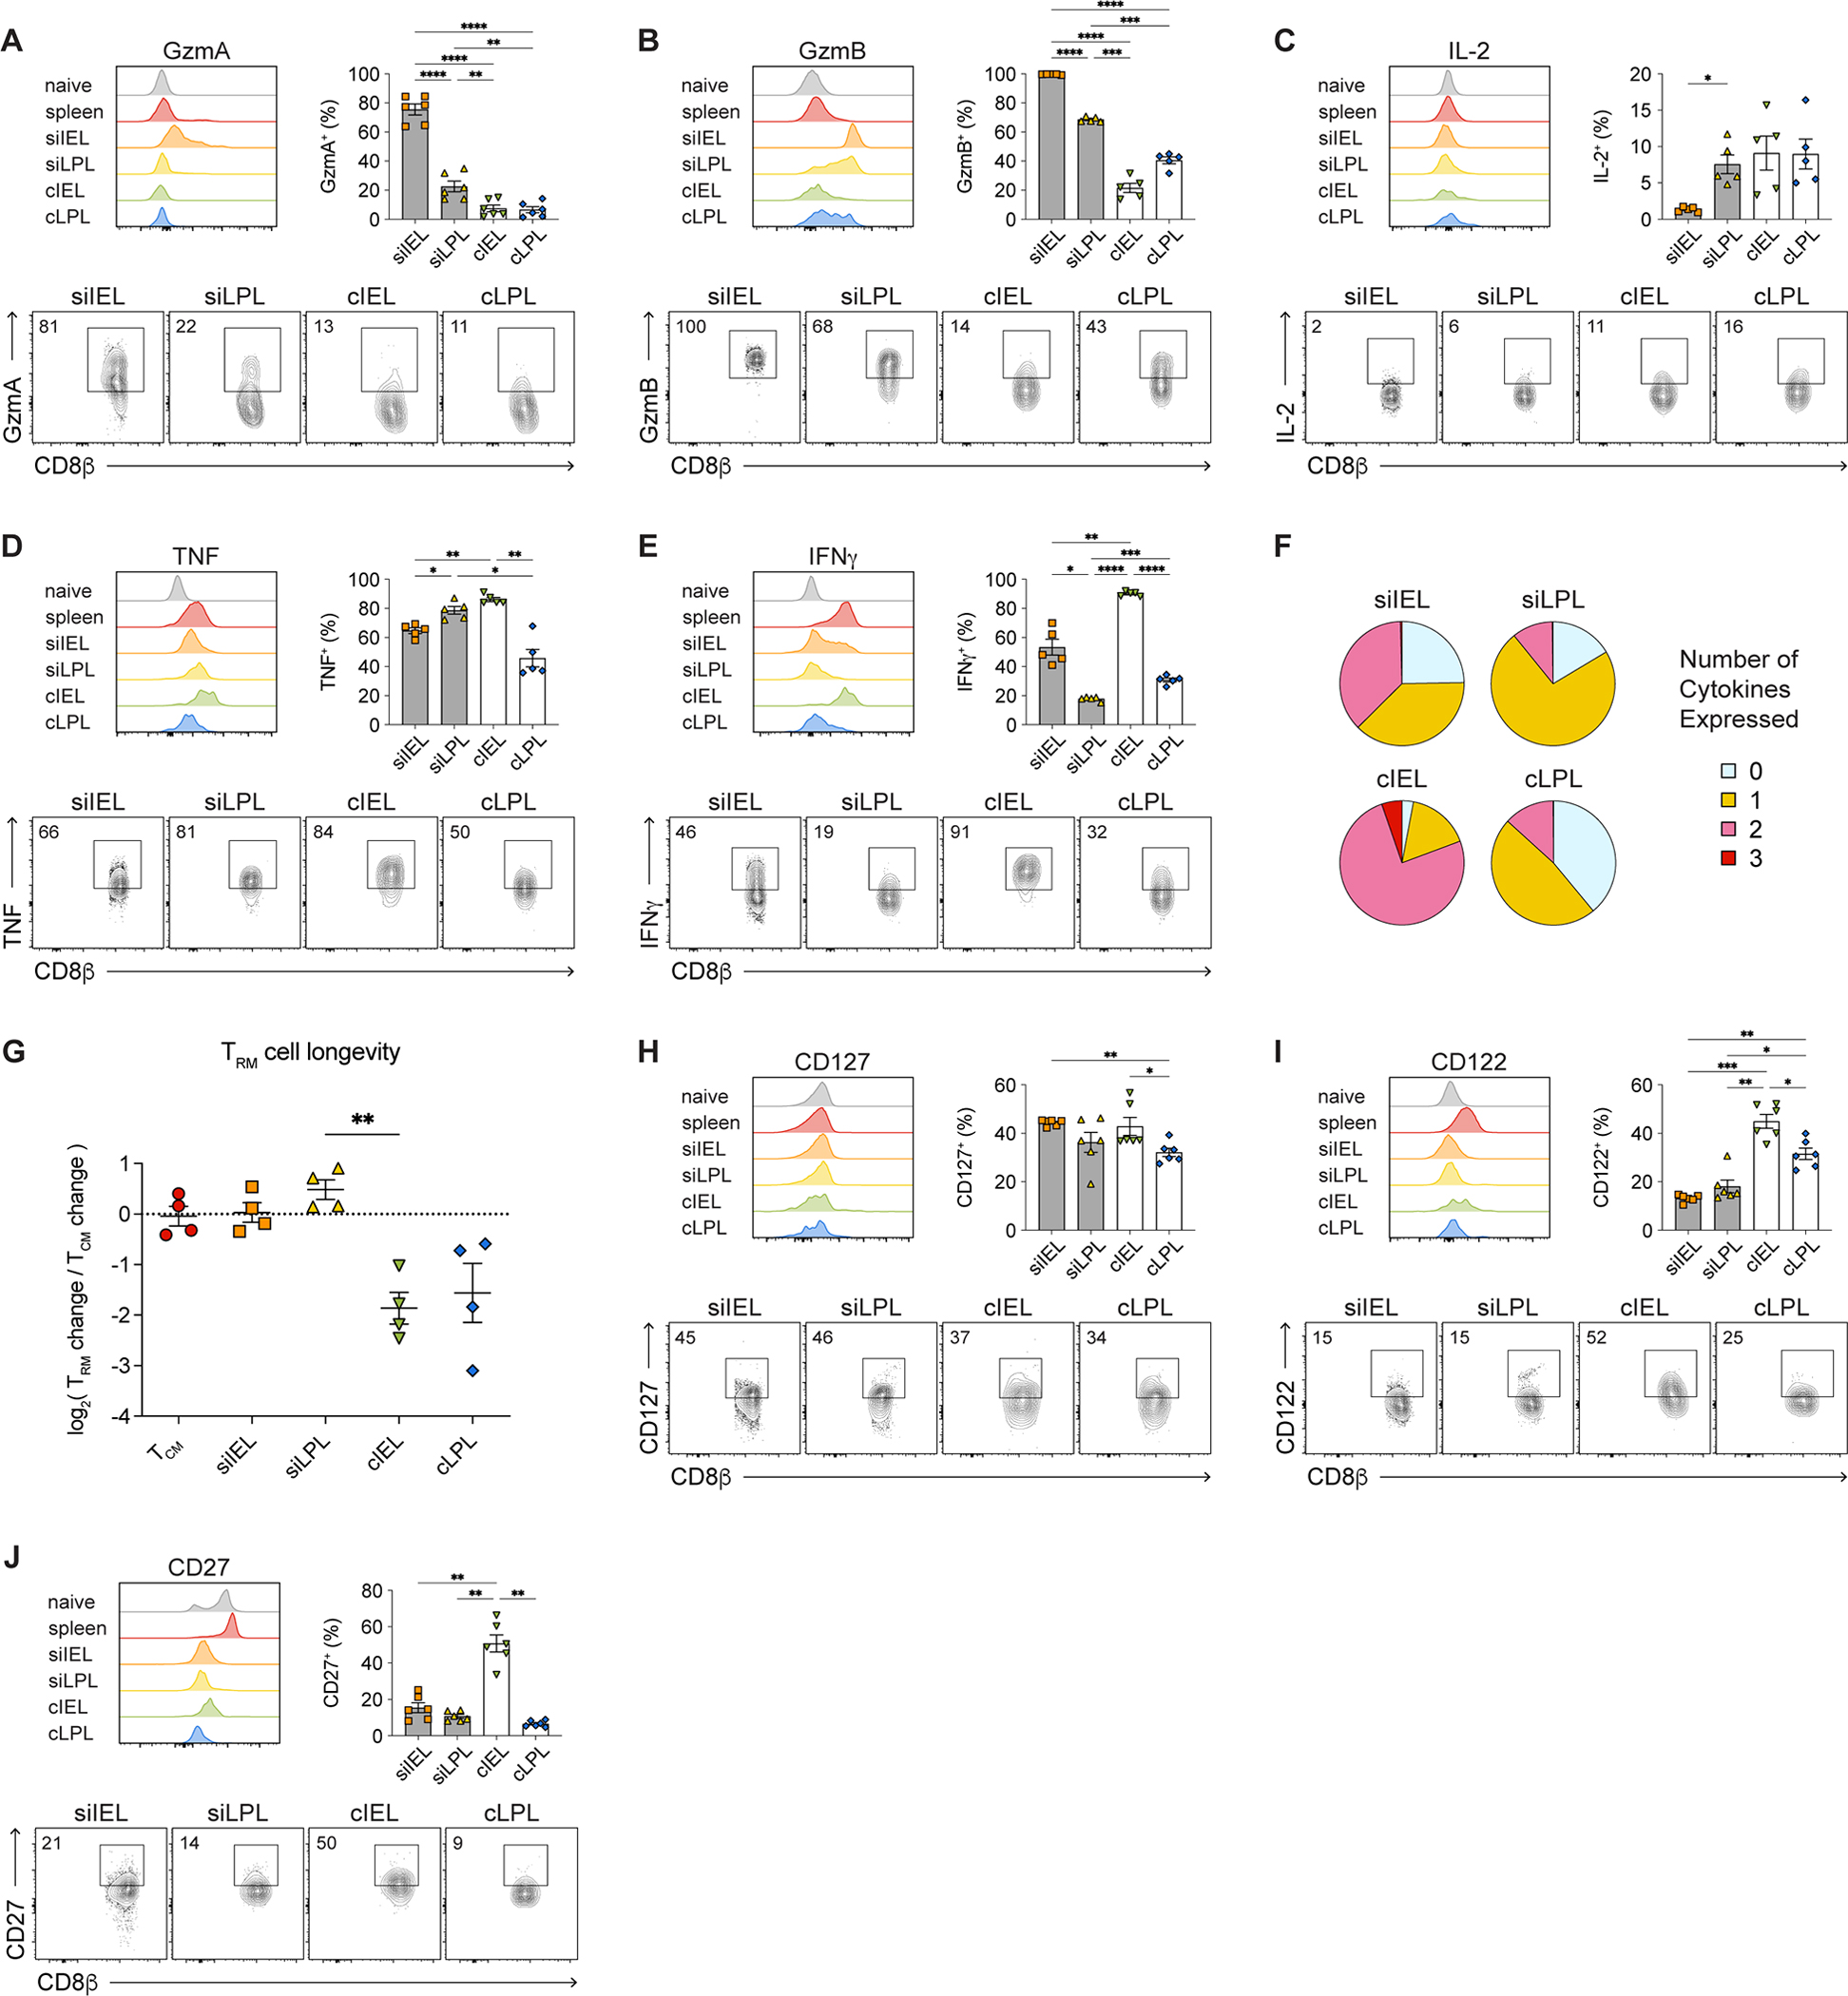
Figure 2. Small intestine IEL CD8+ TRM cells express high levels of granzymes whereas cIEL TRM cells exhibit high potential for cytokine production.

(A–E) Histograms (top left), bar graphs (top right), and representative flow cytometry plots (bottom) showing expression of GzmA (A), GzmB (B), IL-2 (C), TNF (D), and IFNγ (E) by i.v.− intestinal P14 T cells.
(F) Proportions of intestinal T cells expressing 0, 1, 2, or 3 cytokines.
(G) Relative change in numbers of intestinal P14 T cells between days 21 and 80 post-infection, normalized to TCM cells.
(H–J) Histograms (top left), bar graphs (top right), and representative flow cytometry plots (bottom) showing expression of CD127 (H), CD122 (I), and CD27 (J) by intestinal P14 T cells.
Data are represented as mean ± SEM. Repeated measures one-way ANOVA. *p<0.05, **p<0.01, ***p<0.001 ****p<0.0001. Data are representative of ≥3 independent experiments with n=5–6 mice per experiment.
See also Figure S1.
