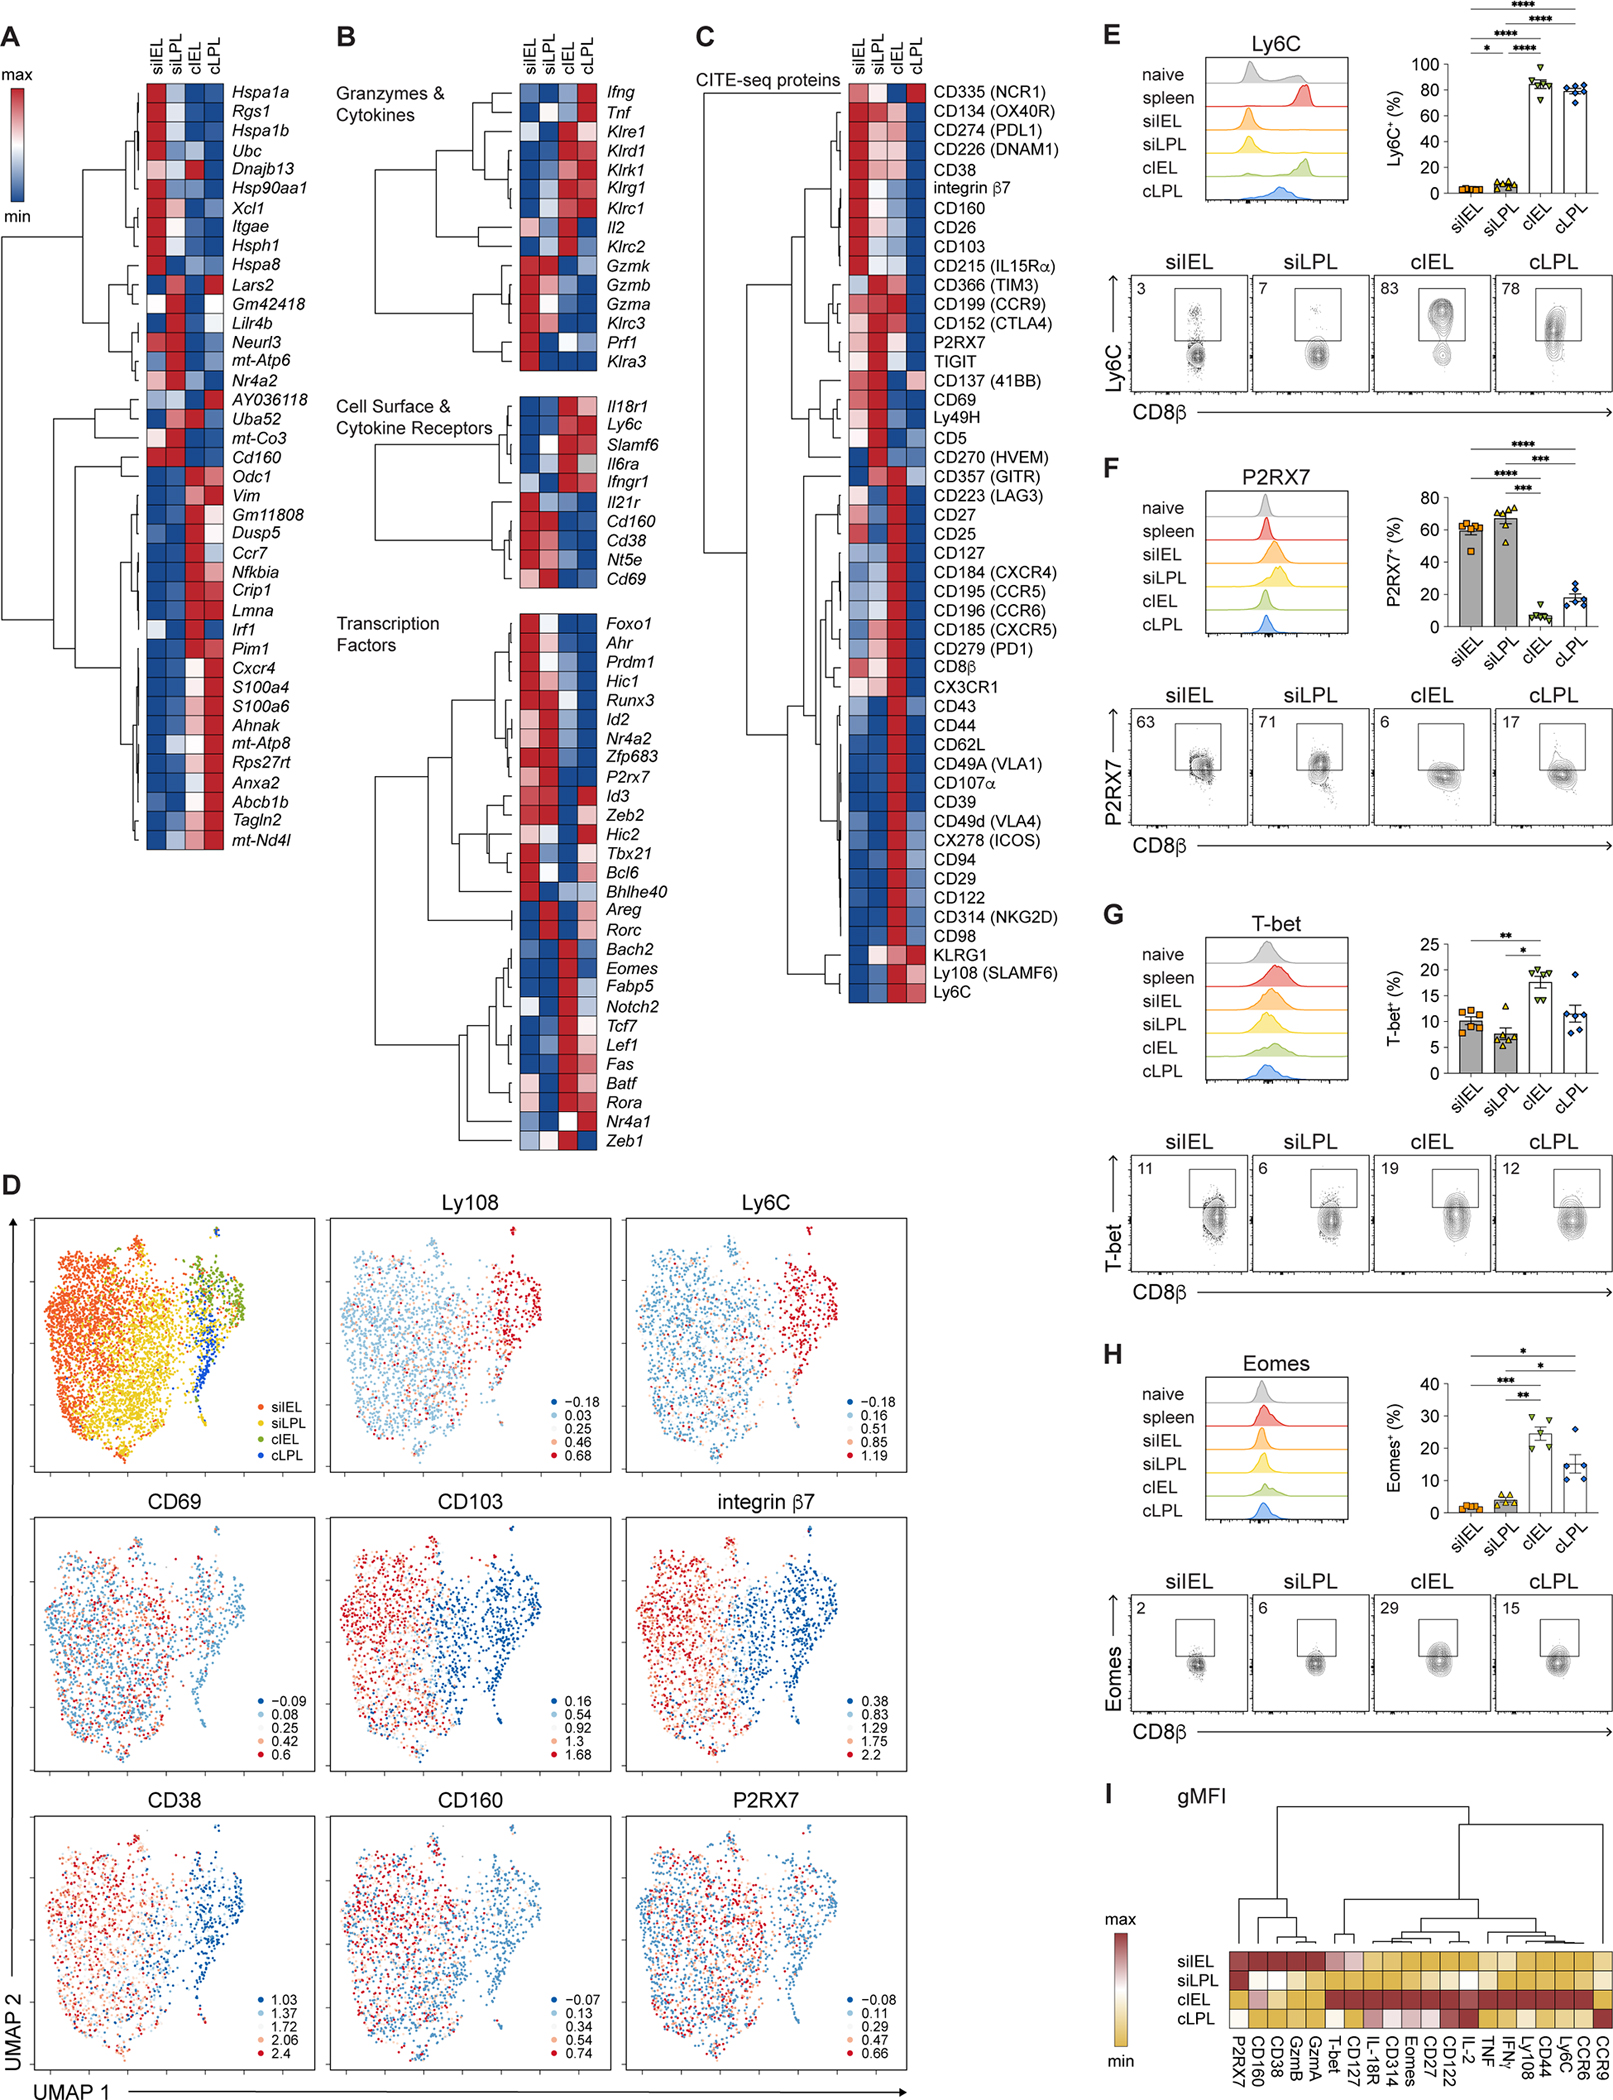
Figure 3. Colon CD8+ TRM cells express higher levels of Eomes than SI TRM cells.

(A-C) Hierarchically clustered summary heatmaps, derived from CITE-seq data, representing top ten genes differentially expressed among intestinal TRM cells (A); relative expression of selected genes, divided by category (B); or relative expression of all proteins included in the CITE-seq antibody panel (C). Rows represent scaled expression of individual genes (A, B) or proteins (C); columns represent TRM cells from each of the 4 intestinal tissue compartments. Values are mapped to colors using the minimum and maximum of each row.
(D) UMAP plots colored by tissue compartment (top left) or expression of selected proteins superimposed onto individual cells.
(E–H) Histograms (top left), bar graphs (top right), and representative flow cytometry plots (bottom) showing expression of Ly6C (E), P2RX7 (F), T-bet (G), and Eomes (H) among intestinal P14 T cells.
(I) Geometric mean fluorescence intensity (gMFI) of expression of selected proteins by intestinal TRM cells, derived from flow cytometry analyses from Figures 2A–2E, 2H–2J, 3E–3H, and S3C–H, represented as a summary heatmap. Values are mapped to colors using the minimum and maximum of each row.
Data are represented as mean ± SEM. Repeated measures one-way ANOVA. *p<0.05, **p<0.01, ***p<0.001 ****p<0.0001. Data are representative of ≥3 independent experiments with n=5–6 mice per experiment.
See also Figures S2–S4 and Table S3.
