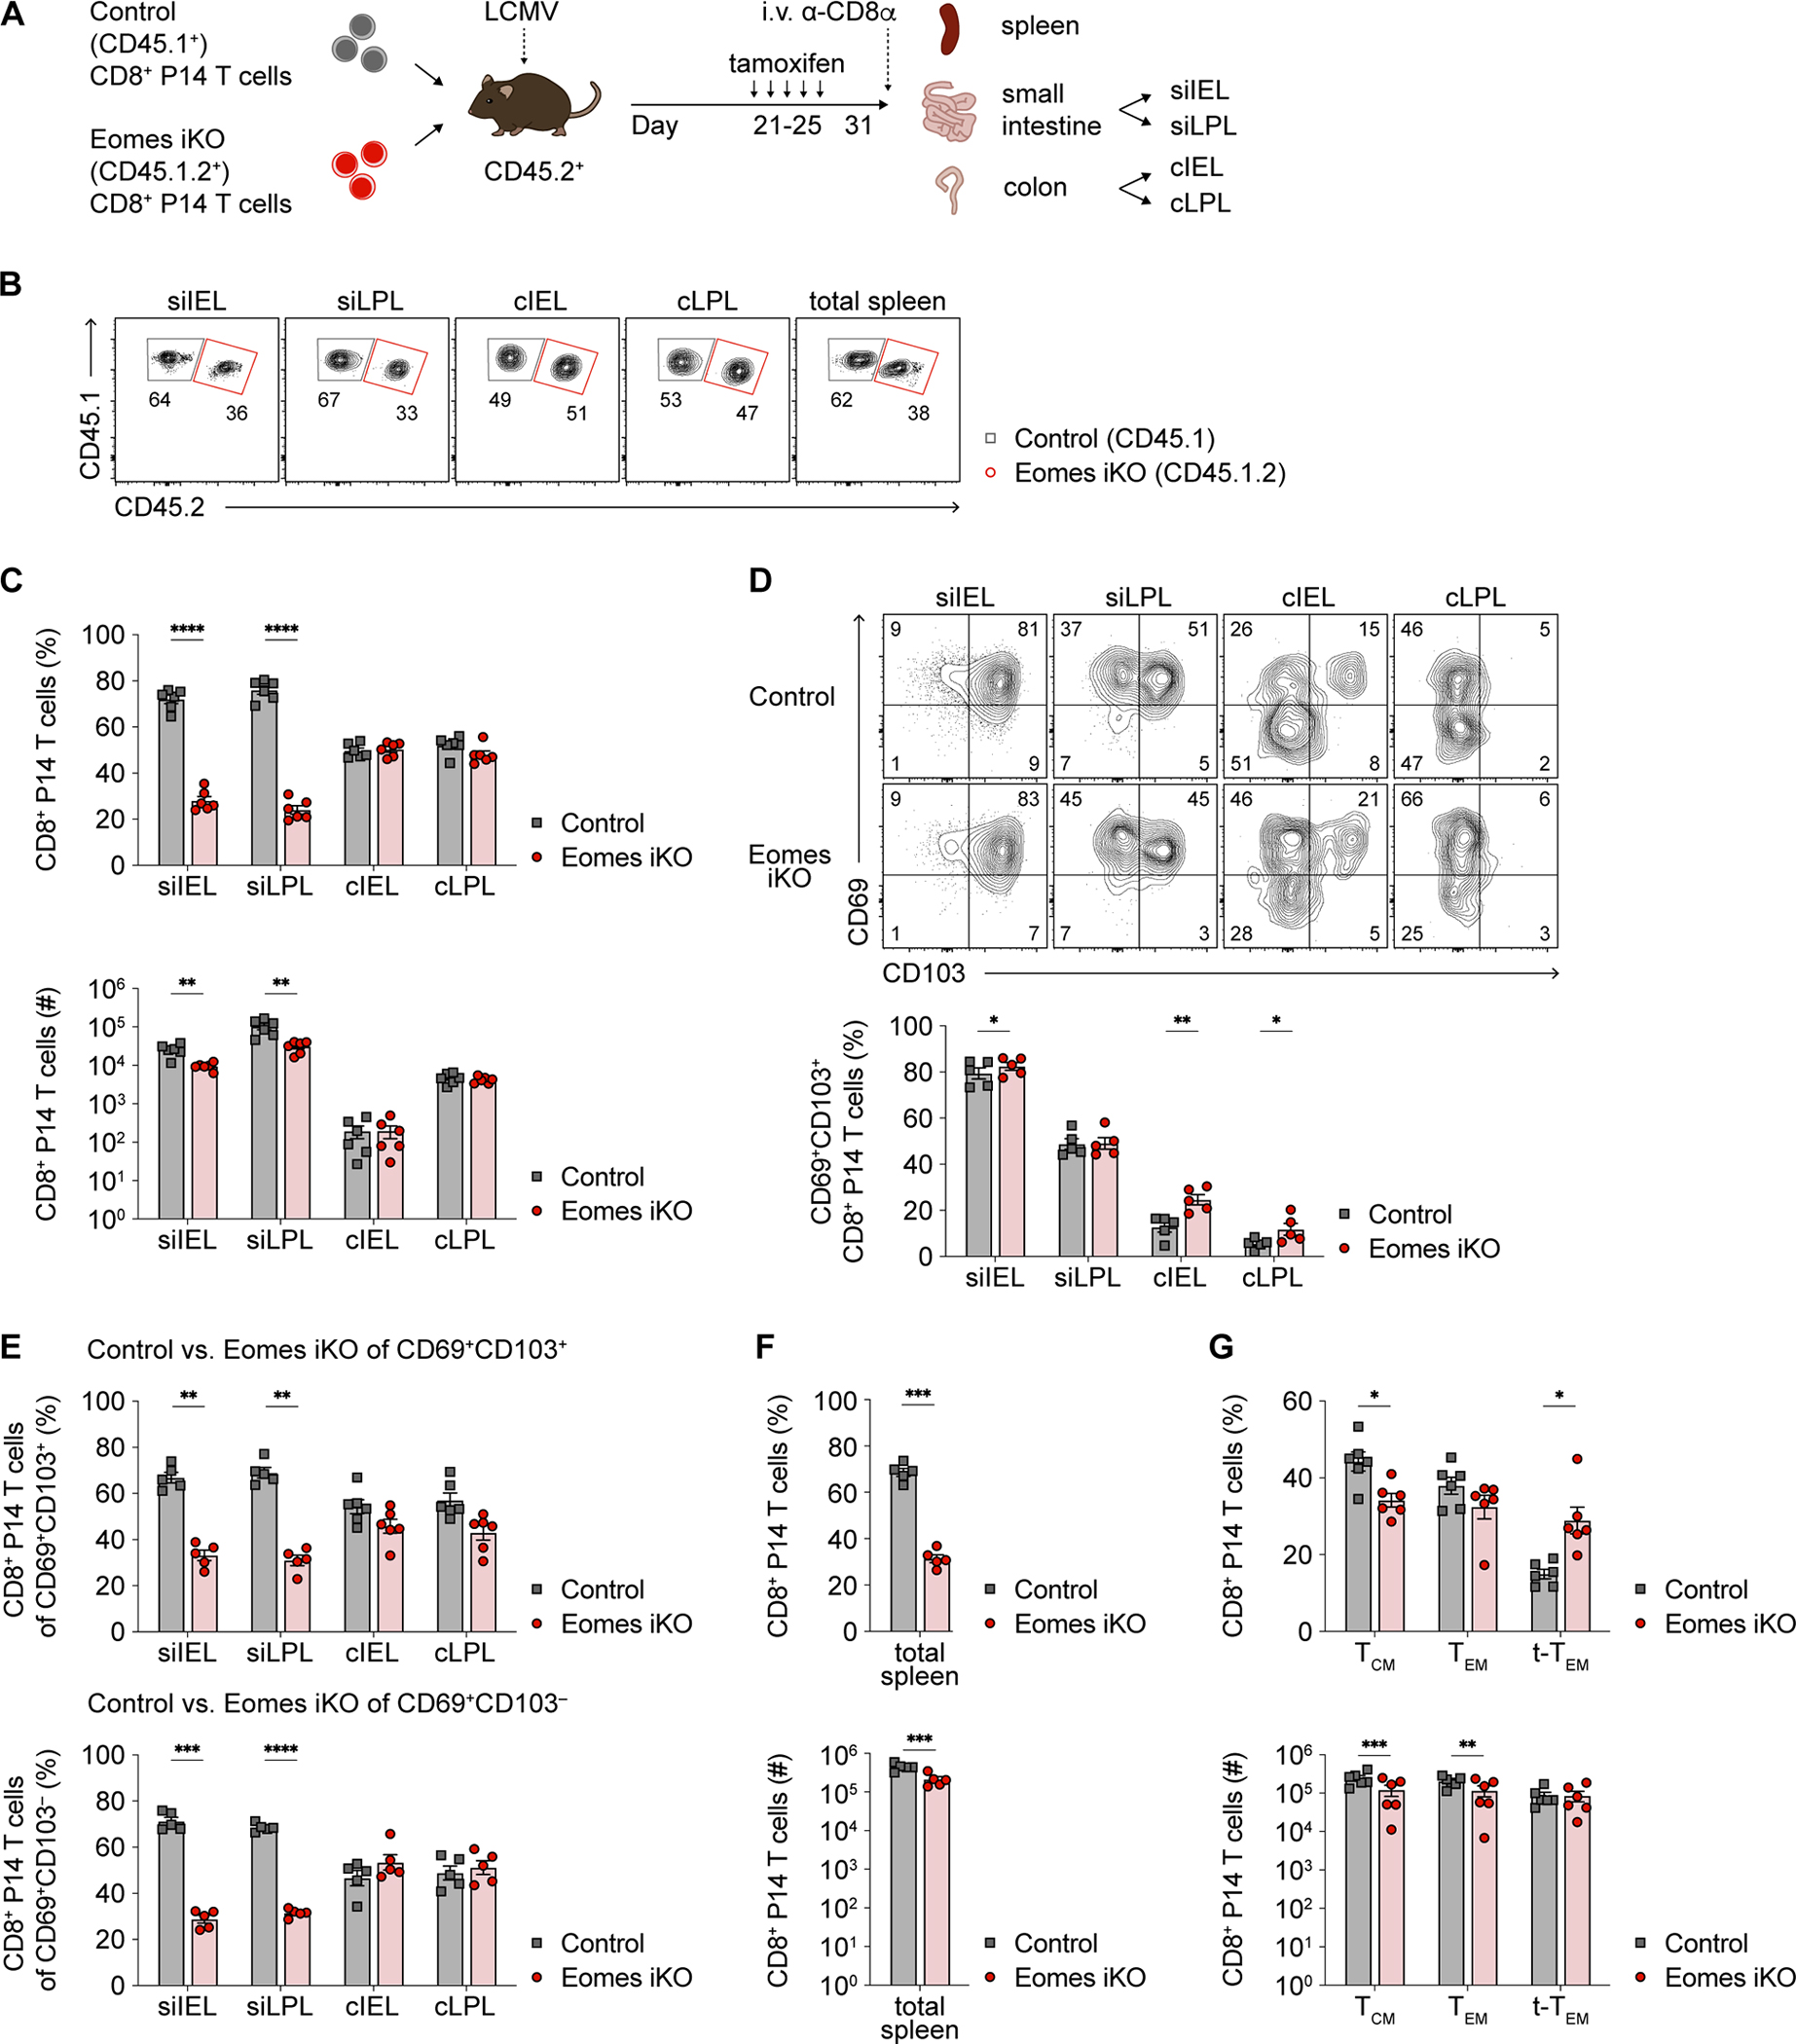
Figure 6. Eomes plays a critical role in maintenance of established SI CD8+ TRM cells.

(A) Experimental design. CD8+ T cells from congenic control and Eomesfl/flErt2-Cre+ (Eomes iKO) P14 mice were adoptively co-transferred at 1:1 ratio into recipients subsequently infected with LCMV. Mice received tamoxifen i.p. once daily x 5 doses starting at day 21 post-infection. Spleen and intestinal P14 T cells were harvested >10 days later.
(B and C) Representative flow cytometry plots (B) and quantification (C) of the proportions (top) or absolute numbers (bottom) of i.v.− control vs. Eomes iKO P14 T cells in each intestinal tissue compartment.
(D) Representative flow cytometry plots (top) and bar graphs (bottom) indicating frequencies of control vs. Eomes iKO intestinal P14 T cells expressing CD69 and CD103.
(E) Proportions of control vs. Eomes iKO P14 TRM cells among CD69+CD103+ (top) or CD69+CD103− (bottom) subpopulations.
(F) Frequencies (top) or absolute numbers (bottom) of total control vs. Eomes iKO P14 T cells in the spleen.
(G) Bar graphs indicating the frequencies (top) or absolute numbers (bottom) of control vs. Eomes iKO TCM (CD62LhiCD127hi), TEM (CD62LloCD127hi), and t-TEM (CD62LloCD127lo) cells.
Data are represented as mean ± SEM. Paired t-test. *p<0.05, **p<0.01, ***p<0.001 ****p<0.0001. Data are representative of ≥3 independent experiments with n=5–6 mice per experiment.
See also Figure S7.
