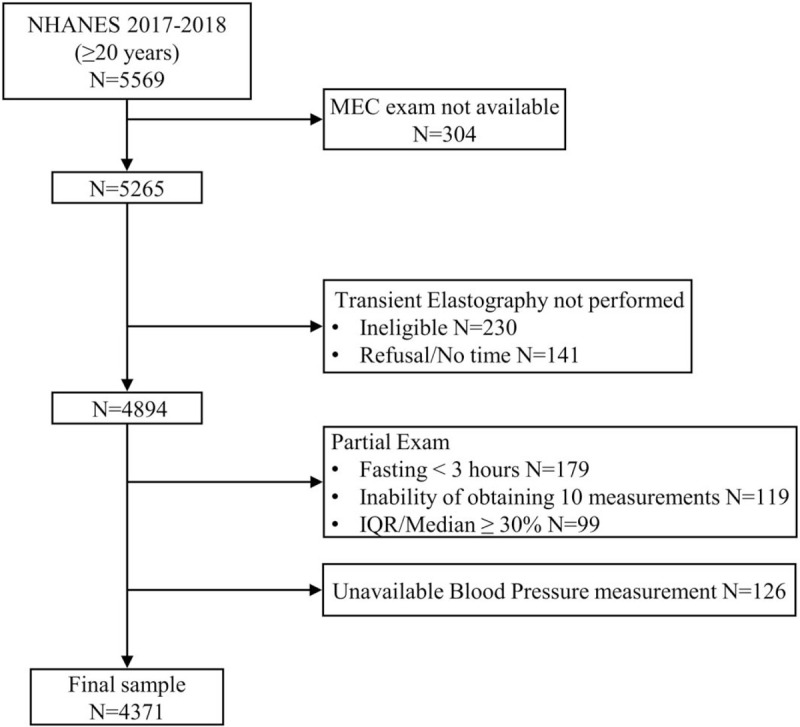
FIGURE 1.

Flow-chart of the study participants. IQR, interquartile range; MEC, Mobile Examination Center; NHANES, National Health and Nutrition Examination Survey.

Flow-chart of the study participants. IQR, interquartile range; MEC, Mobile Examination Center; NHANES, National Health and Nutrition Examination Survey.