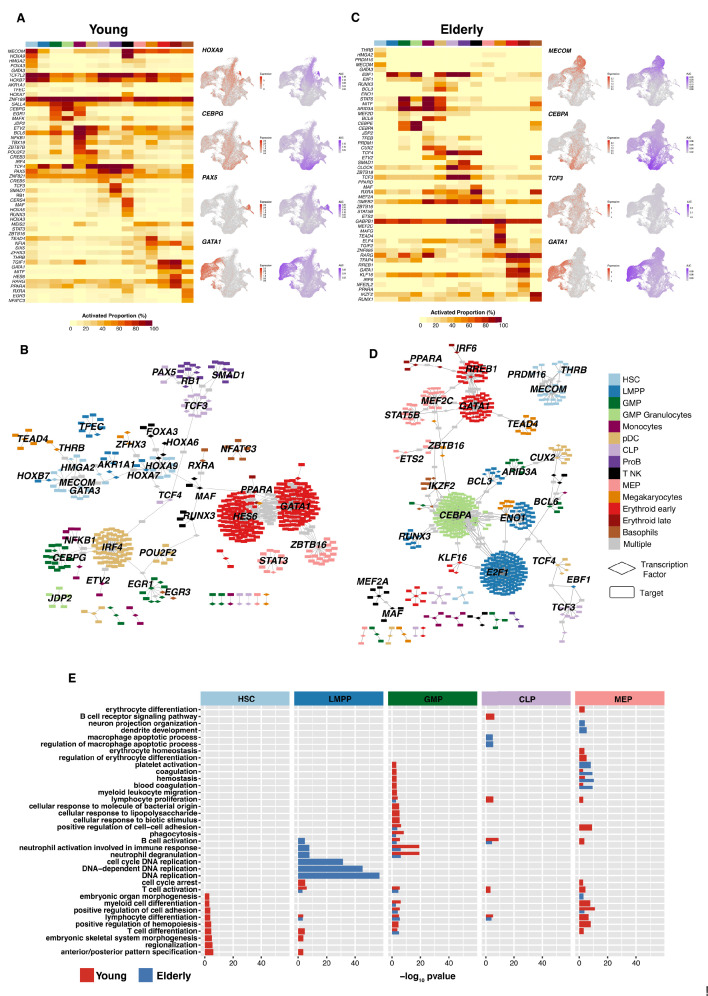
Figure 3. Gene regulatory network reconstruction of hematopoietic cellular populations.
(A) (Left) Heatmap showing the proportion of cells per cluster that have an activated state for different regulons in young cells. (Right) UMAP plots with normalized expression and AUC values for specific transcription factors. (B) Gene regulatory network of the identified regulons for the hematopoietic system in young donors. Regulons were trimmed to include only targets with an importance score higher than the third quartile in each regulon. Node shape denotes gene-type identity, and color denotes cell population. Any target that can be assigned to multiple transcription factors is colored in gray. (C) (Left) Heatmap showing the proportion of cells per cluster that have an activated state for different regulons in elderly cells. (Right) UMAP plots with normalized expression and AUC values for specific transcription factors. (D) Gene regulatory network of the identified regulons for the hematopoietic system in elderly donors. Regulons were trimmed to include only the targets with an importance score higher than the third quantile in each regulon. Node shape denotes gene-type identity, and color denotes cell population. Any target that can be assigned to multiple transcription factors is colored in gray. (E) Bar plot with enriched gene ontology categories after over-representation analysis. Categories are grouped per cell type, and color denotes the enriched group. Bar length represents statistical significance of the enrichment, as -log10 p-value.


