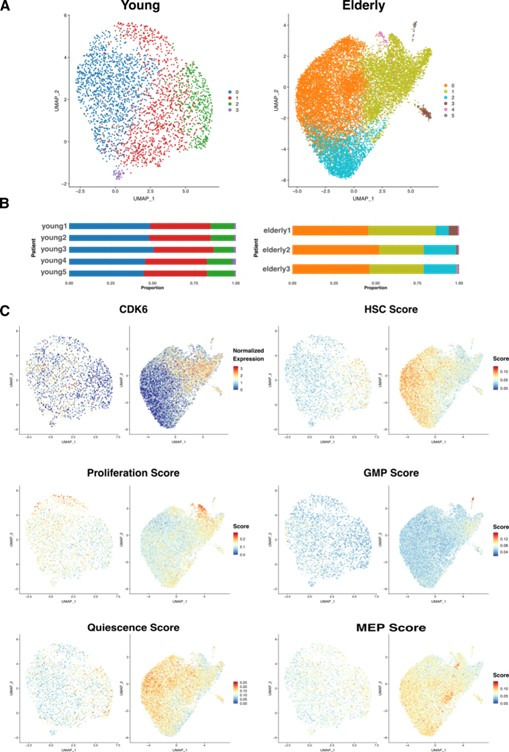
Author response image 4. HSC sub clustering.

(A) UMAP visualization of HSC from young (left) and elderly (right) donors subjected to re-integration and unsupervised clustering.
Cells are colored by clusters. (B) Bar plot showing the proportion of cells from each donor assigned to the different clusters. (C) UMAP plots for young (left) and elderly (right) HSC colored by the normalized expression of CDK6 (top left) and by the summarized expression of multiple gene signatures, quantified as scores calculated using the software AUCell.
