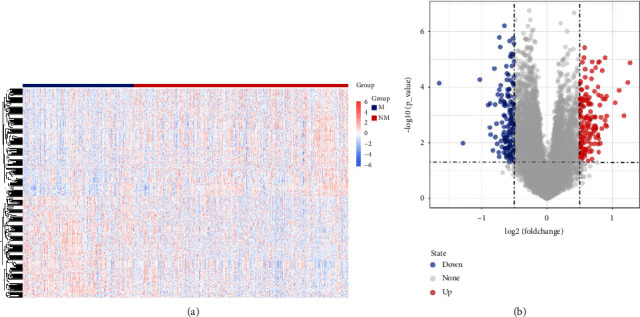
Figure 1.

Identification of differentially expressed genes (DEGs) between metastasis (M) and nonmetastasis (NM) groups. (a) Heatmap of DEGs between M and NM groups. Blue box indicates the M group and red box indicates NM group. (b) Volcano plot showing the DEGs between M and NM groups in TCGA cohort. Blue node represents a lower expression of gene in the M group, and red node represents a higher expression of gene in the M group.
