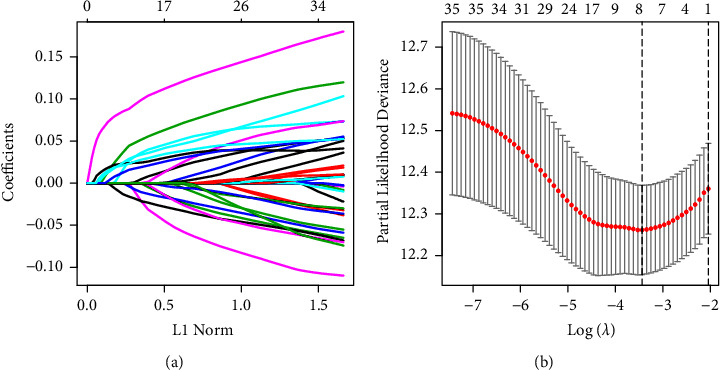
Figure 4.

Identification of prognostic signature in the TCGA cohort. (a) Calculation of LASSO coefficient for each lambda. Each line represents a gene confidence value. (b) Partial likelihood deviance of LASSO coefficient. The two vertical dashed lines represent lambda.min (left line) and lambda.1se (right line). Horizontal axis represents the log (λ) value, while vertical axis represents the partial likelihood deviance of the log (λ) value.
