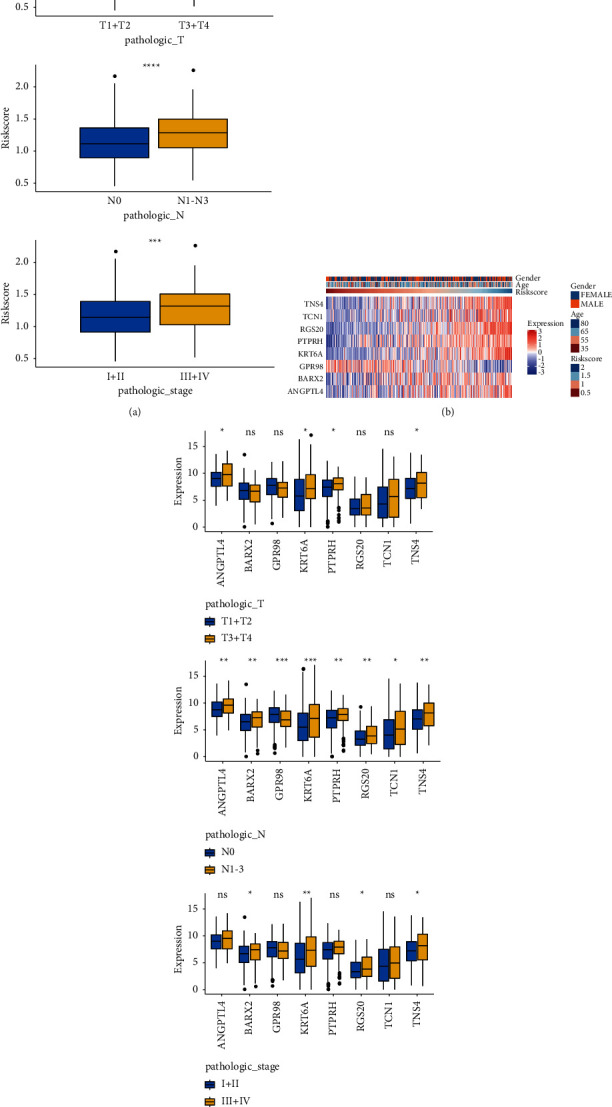
Figure 8.

Correlation analysis of RS and clinical characteristics. (a) RS in subgroups of the T stages (T1 + T2 vs. T3 + T4), N stages (N0 vs. N1–N3), or pathological stages (I + II vs. III + IV). (b) Heatmaps showing the mRNA expression of eight selected genes in TCGA cohort. (c) Correlation of each gene and clinical characteristics (T stages, N stages, and pathological stages). Ns, no significance; ∗p value < 0.05; ∗∗p value < 0.01; ∗∗∗p value < 0.001; ∗∗∗∗p value < 0.0001.
