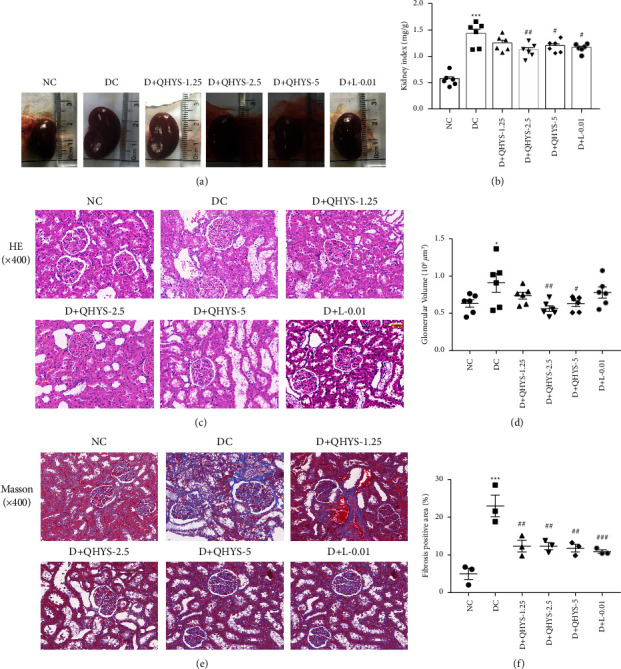
Figure 3.

Morphological changes of the kidney in different groups. (a) Representative images of the kidneys; (b) the kidney index; (c) representative images of H&E staining; (d) quantification of glomerular volume; (e) Masson's trichrome staining showing the glomerular and tubulointerstitium fibrosis of renal sections; (f) quantification of collagen fiber positive area. ∗P < 0.05 vs. NC group. ∗∗∗P < 0.001 vs. NC group. #P < 0.05 vs. DC group. ##P < 0.01 vs. DC group. ###P < 0.001 vs. DC group.
