
Figure 5.
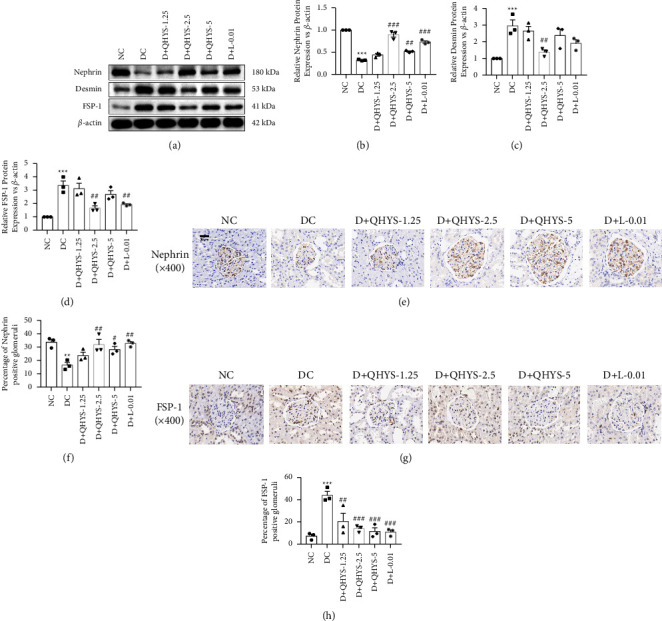
The relative expressions of nephrin, desmin, and FSP-1 in the renal cortex of rats in different groups. (a) Representative images of western blot of nephrin, desmin, and FSP-1; (b–d) semiquantitative analysis of the relative expressions of nephrin, desmin, and FSP-1 proteins; (e) representative images of nephrin IHC staining; (f) semiquantitative analysis of the relative expression of nephrin. (g) Representative images of FSP-1 IHC staining. (h) Semiquantitative analysis of the relative expression of FSP-1. ∗∗∗P < 0.001 vs. NC group. #P < 0.05 vs. DC group. ##P < 0.01 vs. DC group. ###P < 0.001 vs. DC group.