Figure 12.

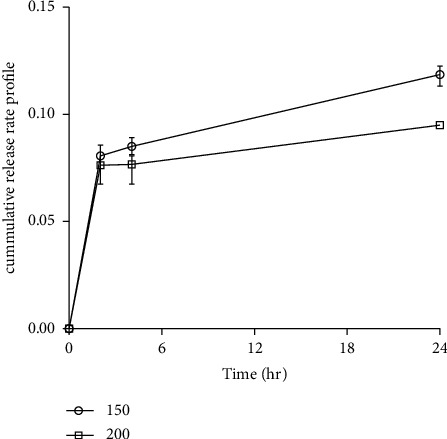
The AgNPs' release profile from DFS scaffold at different time intervals. Error bars shown in figures are the standard deviation of triplicate measurements.

The AgNPs' release profile from DFS scaffold at different time intervals. Error bars shown in figures are the standard deviation of triplicate measurements.