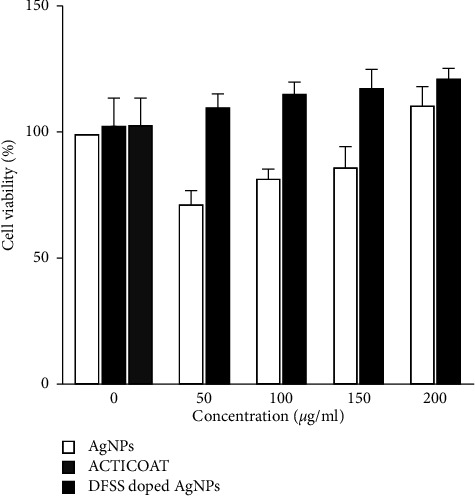
Figure 17.

Cell viability at different concentrations of mouse fibroblast 3T3 cells obtained using the MTT assay after incubation in DFS scaffold, AgNPs, Acticoat, and DFS scaffold doped with AgNPs for 48 hours. Each value represents the mean and standard deviation of the triplicate experiment.
