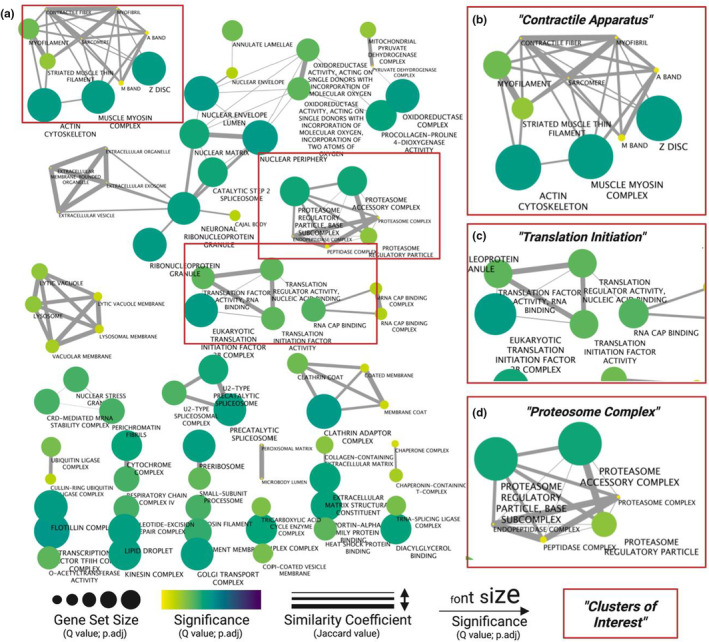
FIGURE 2.

Enrichment map of biological processes related to skeletal muscle RBM3‐bound mRNAs. (a) Enriched genes (FC >3; q‐value <0.01) were used for GSEA using gProfiler, and then clustered and visualized using Cytoscape. Biological processes with overlapping gene sets are connected by edges. Node color and label font size indicate significance of enriched gene set. Edge width corresponds to the similarity coefficient between gene sets. Node size corresponds to gene set size. Significantly enriched ‘hubs’ of (b) Contractile Apparatus, (c) Translation Initiation, and (d) Proteosome Complex are highlighted.
