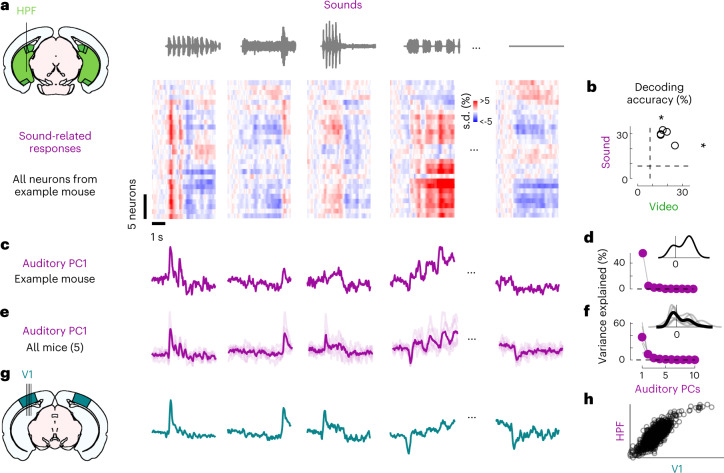
Fig. 2. Sounds evoke stereotyped responses in hippocampal formation.
a, Sound-related time courses for all 28 neurons in HPF in one experiment, sorted using rastermap13. b, Decoding accuracy for video versus sound (asterisk indicates P = 0.031, Wilcoxon right-tailed signed rank test, n = 5 mice). Dashed lines show chance level (1/12). c, Time courses of the first principal component of the sound-related responses in a (‘auditory PC1’, arbitrary units). d, Fraction of total variance explained by auditory PCs, for this example mouse; inset: distribution of the weights of auditory PC1 (arbitrary units). e,f, Same as c and d for individual mice (thin curves) and average of all mice (thick curves). g, Time courses of the auditory PC1 in visual cortex (from Fig. 1), for comparison. h, Comparison of the auditory PC1 from HPF (from e) and from V1 (from Fig. 1); arbitrary units.

