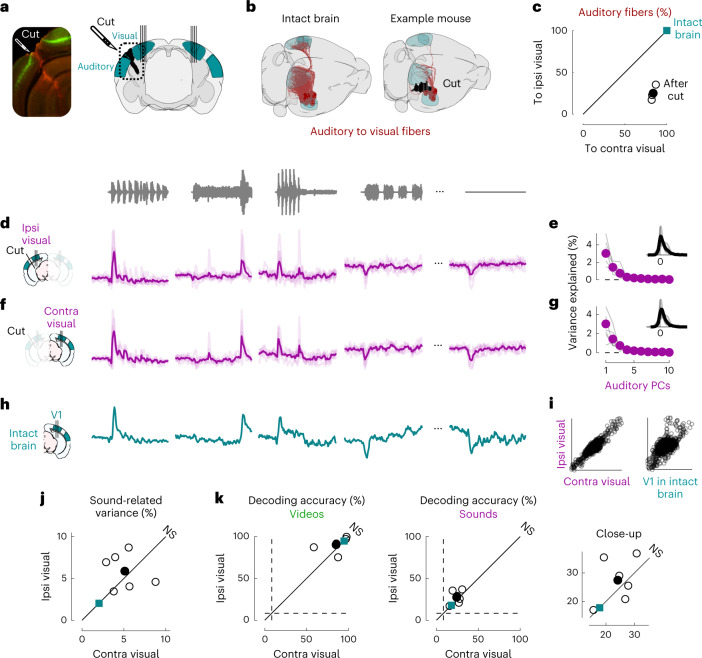
Fig. 3. Sound responses in visual cortex are not due to inputs from auditory cortex.
a, Coronal views of a transectomy cutting the connections between auditory and visual cortex in one hemisphere, showing histology (left) and reconstruction of the cut (right). After the cut, bilateral recordings are performed in visual cortex. b, Three-dimensional visualizations showing auditory to visual fibers (red) in an intact brain (top) versus after the cut (bottom) in an example mouse. c, Auditory input to the sides contralateral versus ipsilateral to the cut for all three mice (open dots) and their average (filled dot), normalized by the input expected in intact brains (turquoise dot). d, Time courses of the first principal component of the sound-related responses (‘auditory PC1’) on the side ipsilateral to the cut (average over all mice). Thin curved lines show individual mice. e, Fraction of total variance explained by auditory PCs on the side ipsilateral to the cut; inset: distribution of the weights of auditory PC1 for all mice. f,g, Same as d and e for the side contralateral to the cut. h, Time courses of the auditory PC1 in visual cortex of intact, control mice (from Fig. 1) for comparison. i, Comparison of the auditory PC1 from the sides contralateral and ipsilateral to the cut (left, from d versus f) and from V1 (right, taken from b versus Fig. 1); all arbitrary units. j, Sound-related variance explained by the first four auditory PCs on the ipsi- versus contralateral side, showing individual sessions (open dots), their average (black dot) and the average across control mice (turquoise dot) (Wilcoxon two-sided paired signed rank test, n = 6 sessions across three mice). k, Decoding accuracy for videos (left) and sounds (middle and right, showing close-up) (Wilcoxon two-sided paired signed rank test, n = 6 sessions across three mice). Symbols are as in j.

