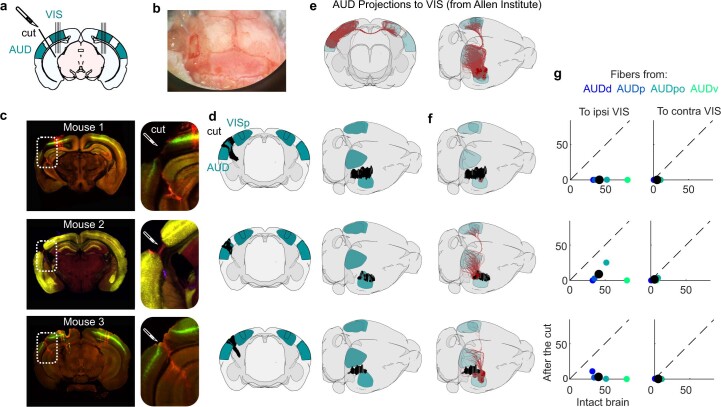
Extended Data Fig. 3. Transectomy cut most of the fibers from auditory to visual cortex.
a. Schematic of the transectomy experiments: the connections between auditory (AUD) and visual (VIS) cortex are cut on one side. Subsequently, recordings are performed in visual cortex, in both hemispheres. b. Picture from above of the mouse skull during surgery, with a craniotomy performed on the left side. c. Histology of the three mouse brains, showing the cut (inset), and the probe tracks (DiI and DiO staining, mainly visible in mice 1 and 3). d. 3D reconstructions of the cut, shown from a coronal view (left) or from above/sideways (right). e. Fiber tracks from the auditory cortex to the visual cortex in intact mice, from 53 experiments performed in the Allen Mouse Brain Connectivity atlas26, see Methods). f. Estimated intact fibers after the cut, for the 3 mice. g. Estimate of the number of fibers before the cut (abscissa) and after the cut (ordinate) for each mouse, in ipsilateral (left) and contralateral visual cortex (right). The color of the dots indicates the auditory area from which the fibers originated (Allen Mouse Brain Connectivity Atlas). The black dot shows the average over all 53 experiments performed for the Atlas.

