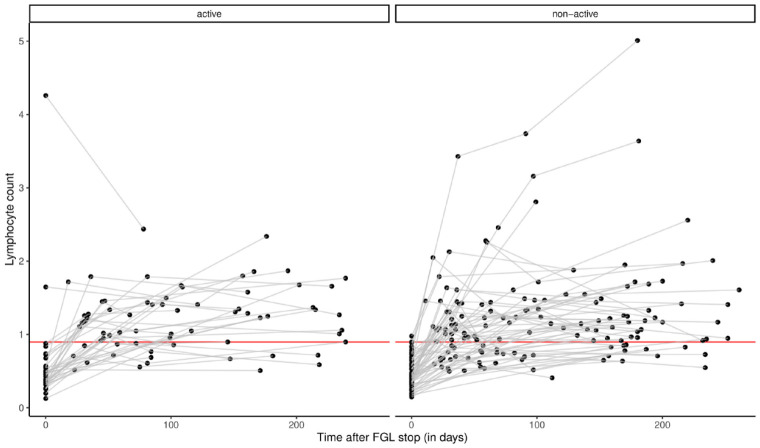
Figure 2.
Lymphocyte counts after fingolimod discontinuation in active and nonactive group. Y-axis represents the lymphocyte counts (×109/l). X-axis represents the time after FGL stop in days. The values at time = 0 indicate the first lymphocyte counts after FGL start. The red line indicates the lowest lymphocyte normal count (for statistical comparison, see Table 2).
FGL, fingolimod.

