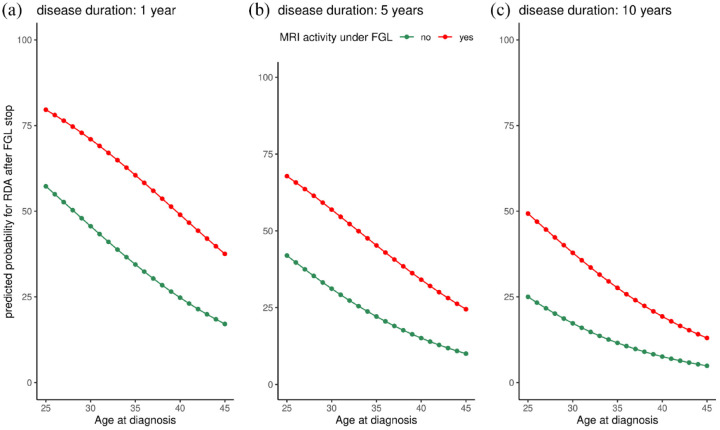
Figure 3.
Predicted probability for recurring disease activity. Predictive probability for recurring disease activity (Y-axis) in patients with a disease duration of 1 year (a), 5 years (b), and 10 years (c) depending on age at diagnosis (X-axis) and the presence of MRI activity under FGL (red line indicates the presence of MRI activity under FGL and green line indicates the absence of MRI activity under FGL).
FGL, fingolimod.

