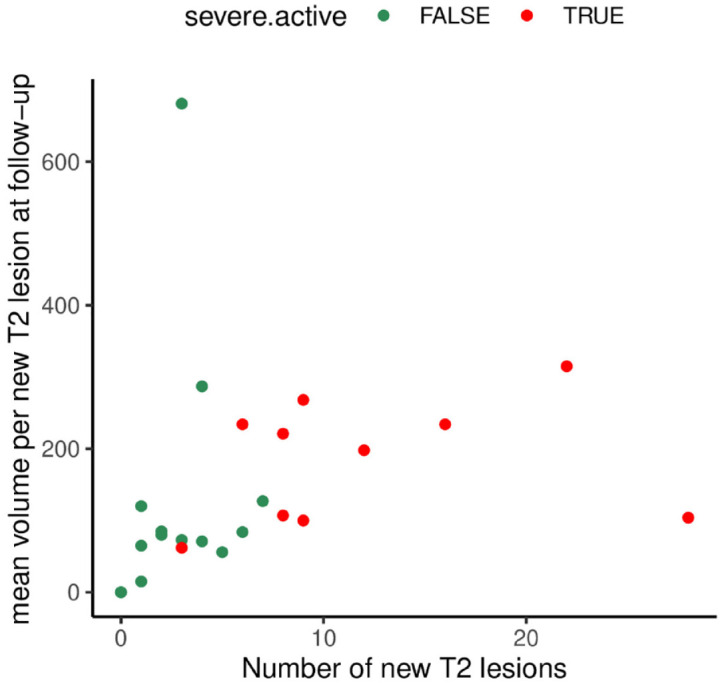
Figure 4.

MRI patterns of active patients at follow-up. The graphic represents the mean volume per new T2 lesion at follow-up (mm3, Y-axis) and the number of new T2 lesions (X-axis) in patients with severe recurring disease activity (red) versus patients with nonsevere recurring disease activity (green). Patients with severe recurring disease activity had (per definition) a higher number of T2 lesions, but there was no specific MRI pattern detectable.
