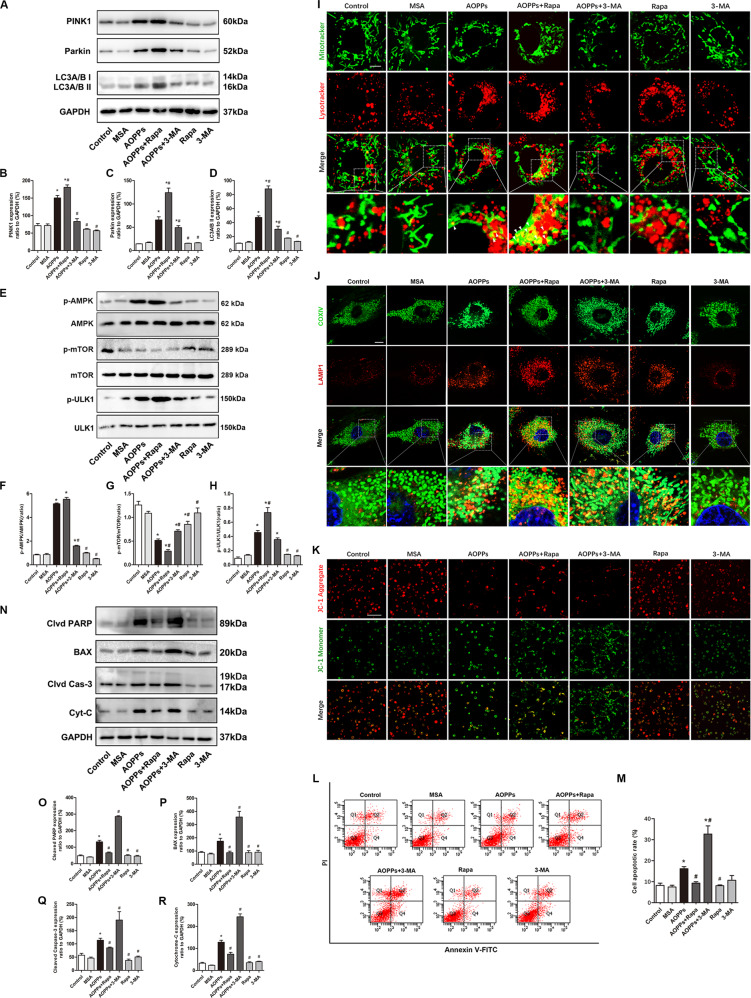
Fig. 3. PINK1/Parkin-mediated mitophagy inhibited AOPP-induced MC3T3-E1 cell apoptosis.
A–D AOPP treatment significantly increased PINK1, Parkin, and LC3A/B-II expression, and this tendency was further upregulated by rapamycin or inhibited by 3-MA. E–H AOPPs increased the phosphorylation of AMPK and ULK1 while decreasing mTOR phosphorylation. Rapamycin decreased the phosphorylation of mTOR but had no significant effect on AMPK or ULK1 phosphorylation. Rapamycin combined with AOPPs further decreased the phosphorylation of mTOR and increased the phosphorylation ULK1, but had no significant effect on AMPK phosphorylation. 3-MA significantly decreased the AOPP-induced phosphorylation of AMPK and ULK1. I The MitoTracker Green/LysoTracker Red fluorescence results showed that AOPP stimulation significantly increased mitophagy (white arrow), and this tendency could be further enhanced by rapamycin or inhibited by 3-MA (scale bar = 10 μm). J Co-localization of mitochondrial protein COX IV and LAMP1 by immunofluorescence staining showed AOPP stimulation significantly increased mitophagy, and this tendency could be further enhanced by rapamycin or inhibited by 3-MA (scale bar = 10 μm). K The JC-1 results showed that rapamycin could significantly reverse the AOPP-induced ΔΨm decrease, but 3-MA further exacerbated the damaging effect of AOPPs on mitochondria (scale bar = 100 μm). L, M Flow cytometry results showed that AOPP-induced MC3T3-E1 cell apoptosis could be inhibited by rapamycin but further exacerbated by 3-MA. Rapamycin or 3-MA alone had no significant effect on the cell apoptotic rate. N–R The AOPP-induced expression of cleaved PARP, BAX, cleaved Caspase-3 and cytochrome c was significantly inhibited by rapamycin but further upregulated by 3-MA. However, rapamycin or 3-MA alone had no significant effect on apoptotic protein expression compared with the control group. All experiments were repeated for at least three times. Data are presented as the mean ± SD. *P < 0.05 versus control. #P < 0.05 versus the AOPPs group. Clvd PARP, cleaved PARP; Clvd Cas-3 cleaved Caspase-3; Cyt-C cytochrome c.

