
Figure 10.
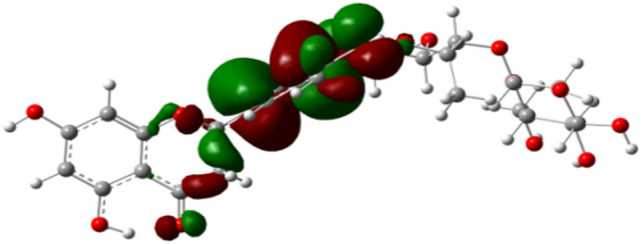
HOMO distribution map of the frontier orbital of the new flavonoid. Red color represents the positive part of the molecular orbital, while the green color represents the negative part.
Official websites use .gov
A
.gov website belongs to an official
government organization in the United States.
Secure .gov websites use HTTPS
A lock (
) or https:// means you've safely
connected to the .gov website. Share sensitive
information only on official, secure websites.
HOMO distribution map of the frontier orbital of the new flavonoid. Red color represents the positive part of the molecular orbital, while the green color represents the negative part.