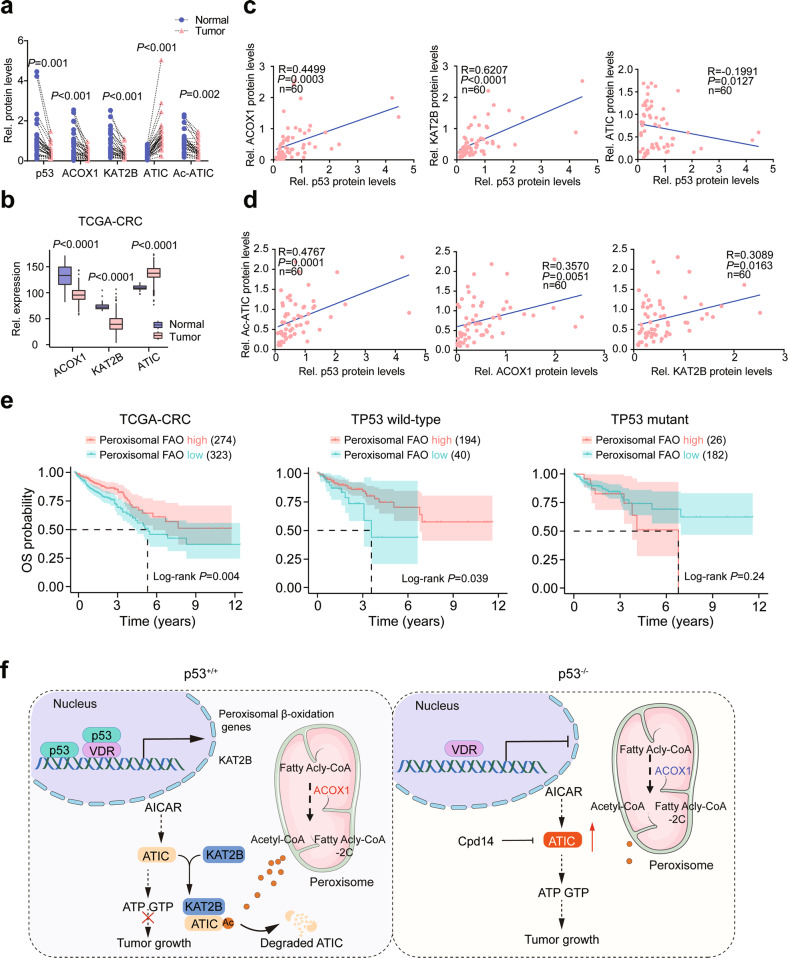
Fig. 7. Acetylation of ATIC is downregulated in human CRCs.
a Relative protein levels of p53, ACOX1, KAT2B, ATIC. The results shown are from the same tissues shown in Fig. S7a. Signal intensity of these proteins were quantified by Image J, and then normalized to β-actin band intensity. b ACOX1, KAT2B, ATIC expression in CRC tumors and normal colorectal tissues. The raw data from TCGA. c Correlation between the expression levels of p53 and ACOX1, KAT2B, ATIC, as determined by Pearson’s r analysis. The results shown are from the same tissues shown in Fig. S7a. d Correlation between the expression levels of Ac-ATIC and p53, ACOX1, KAT2B, as determined by Pearson’s r analysis. The results shown are from the same tissues shown in Fig. S7a. e Kaplan–Meier analysis of overall survival (OS) in CRC patients according to the expression of peroxisomal FAO. P values were calculated by log-rank test. The raw data was from TCGA. f Schematic illustration of the mechanistic model for the role of p53-mediated peroxisomal β-oxidation-ATIC axis in colorectal tumorigenesis. Data were presented as mean ± SD.

