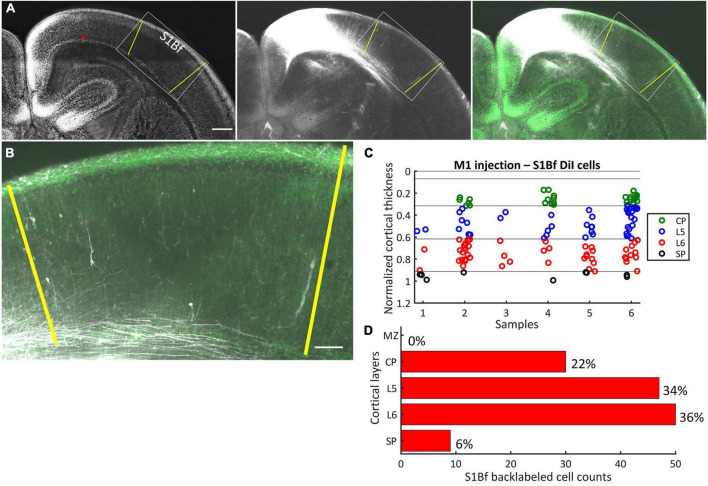
FIGURE 2.
DiI labeling pattern and localization of DiI backlabeled cells in S1Bf on six M1 injected samples. (A) Representative photomicrograph showing the DiI labeling pattern in S1Bf on M1 injected sample. Image was prepared as a maximum intensity projection of selected stacks of 350 μm thick sample. Left panel: NeuN counterstain of DiI injected sample. Red asterisk indicates the DiI injection site in M1. Yellow lines demark S1Bf from the adjacent primary somatosensory cortices, according to reference points in the developing mouse brain atlas (Paxinos, 2007). Middle panel: DiI tracer spreading pattern toward S1Bf. Right panel: Composite image of the DiI signal and the NeuN signal showing the DiI spread toward S1Bf. (B) Representative S1Bf area, as indicated in the rectangle on panel (A), showing backlabeled cell distribution across cortical layers. Scale bars are 500 μm (A) and 100 μm (B). (C) Scatter plot showing the localization of manually detected somata of backlabeled cells through the normalized cortical thickness in six S1Bf injected samples. Zero level at the y axis refers to the pial surface, level 1 indicates the SP-white matter boundary. (D) Quantification of observed counts of backlabeled cells in M1.

