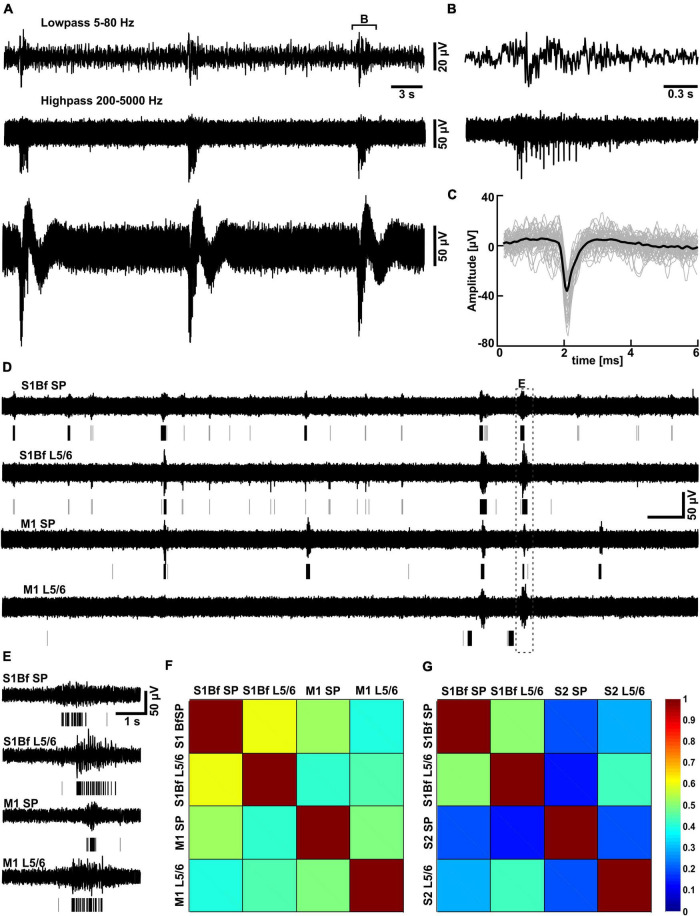
FIGURE 5.
Partially correlated discontinuous multiunit activity in low Mg2+-ACSF. (A) Typical trace recorded with one MEA electrode located in L5/6 of S1Bf. Above the trace the highpass-filtered signal used for the spike detection and the lowpass-filtered signal are displayed. (B) Representative interval of a burst as depicted in panel (A). (C) Plot of individual spikes identified by the threshold-crossing detector (gray traces) and the average spike waveform (black trace). (D) Simultaneous recording of multi-unit activity (MUA) in the subplate (SP) and in L5/6 of S1Bf and M1 recorded in low Mg2+ ACSF. The lines beneath the trace indicate identified spikes, isolated spikes are represented by gray lines, spikes belonging to a burst by black lines. Note the frequent occurrence of burst-like activity transients in all areas and that burst like activity was only partially correlated between the investigated regions. (E) Representative interval of a burst correlated between all electrodes [as indicated in panel (A)] illustrating a significant delay in the onsets of the bursts between the recordings. (F) The correlation matrix for electrode pairs inserted in S1Bf and M1 revealed that the bursts were only partially correlated between regions, with the highest degree of correlation observed between S1Bf SP and S1 L5/6 and the lowest degree of correlation between S1Bf SP and M1 L5/6. (G) Correlation matrix for electrode pairs inserted in S1Bf and S2. Note the overall lower degree of correlation between S1Bf and S2 as compared to S1Bf–M1 recordings.

