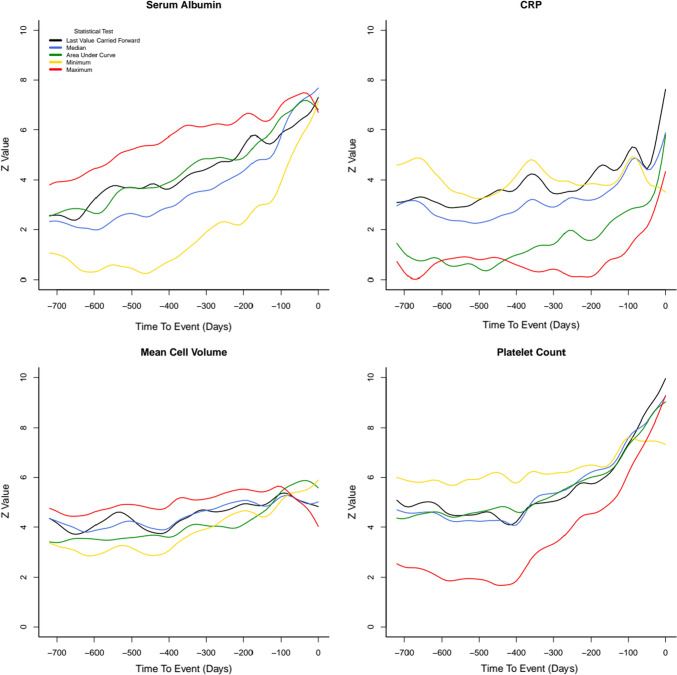
Fig. 1.
Z value for univariate cox proportional hazard analyses of association between complication and laboratory variable (albumin, CRP, MCV, and platelet count), using varying statistical methods to represent the laboratory variable. The event horizon decreases from 720 to 0 days from left to right in each graph. For variables that tend to rise with illness (CRP, platelet count), minimum value during window period was the representative statistic most strongly associated with complication. For variables that tend to fall with illness (albumin, hemoglobin, mean cell volume), maximum value was most strongly associated with complication

