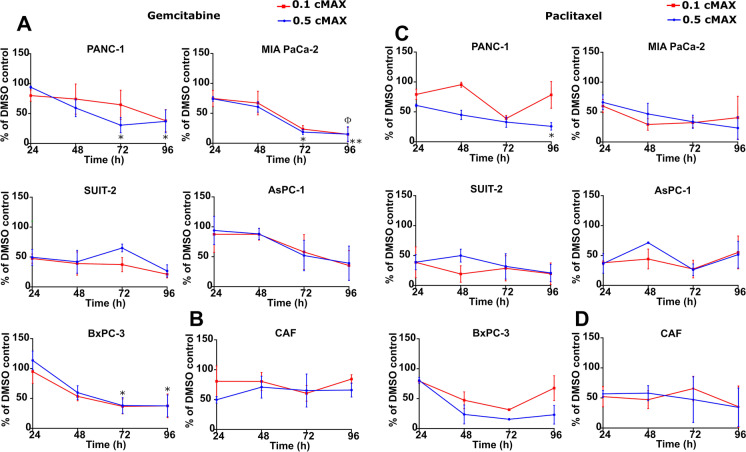
Fig. 2.
Chemotherapeutic pulsing with gemcitabine and paclitaxel to mimic clinical dosing in vitro. (A and C) The graphs show the cell viability of pancreatic cancer cell lines after a pulse with gemcitabine (A) or paclitaxel (C) representing 0.5 cMAX or 0.1 cMAX, data was analysed using DMSO as a control set to 100%. (B and D) The graphs show the cell viability of CAFs after a pulse with gemcitabine (B) or paclitaxel (D) representing 0.5 cMAX or 0.1 cMAX. At 24, 48, 72 and 96 h cell viability was determined using CellTiter-Glo. The data are shown as ± SEM of at least 2 independent experiments performed in triplicate and normalised to a DMSO control set to 100%. P value determined by one-way ANOVA with post hoc Dunnett’s test. The * symbol refers to the 0.5 cMAX condition with *P ≤ 0.05 and **0.01. The Φ symbol refers to the 0.1 cMAX condition with Φ P ≤ 0.05

