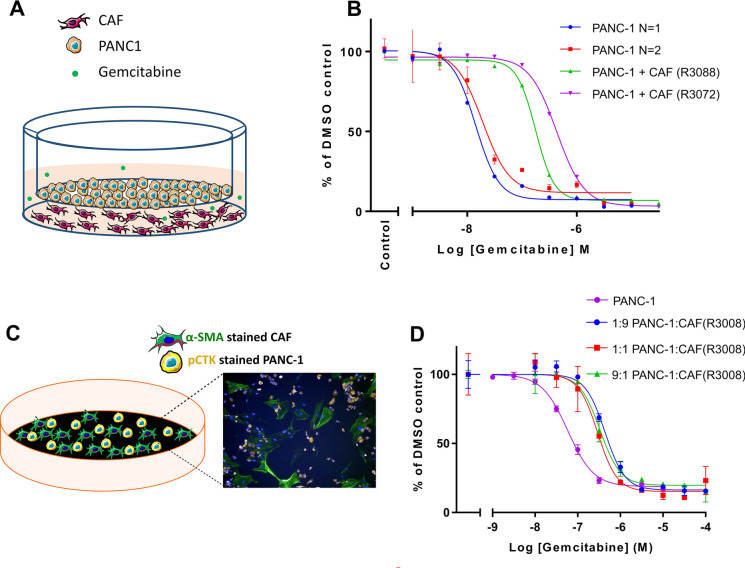
Fig. 3.
The addition of CAFs to 2D screening models reduces the anti-proliferative effect of gemcitabine on PANC-1 cells. (A) Schematic representation of a transwell co-culture model in which the two cell populations are separated by a physical barrier. In this model, CAFs were placed in the bottom chamber and PANC-1 cells were on the transwell insert (1:1 ratio). (B) Dose–response curve showing the efficacy of gemcitabine in killing PANC-1 cells in a transwell co-culture model of CAFs and PANC-1 cells. Cells were cultured for 72 h in the presence of gemcitabine. The cell viability of PANC-1 cells was measured using CellTiter-Glo. The data are shown as mean ± SD of one assay for two CAFs (R3088 and R3072) and normalised to a DMSO control set to 100%. (C) Schematic representation of the direct 2D co-culture model with an image depicting anti-αSMA-488 labelled CAFs (Green), anti-CTK-594-labelled PANC-1 cells (Yellow) and nuclei (Blue). The average nuclei count was measured using an Operetta (PerkinElmer), counting 4 randomly assigned areas of interest/well. (D) Dose–response curve showing the direct 2D cell viability assay using three different ratios of CAF to PANC-1 cells compared to PANC-1 cells alone. Cells were exposed to gemcitabine and DMSO as control. At 72 h, cell viability was determined by counting nuclei which were associated with positive pCTK staining (considered PANC1 cells) and which were not associated with areas of positive αSMA staining (considered CAFs). The data are shown as mean ± SD of one assay performed in triplicate

