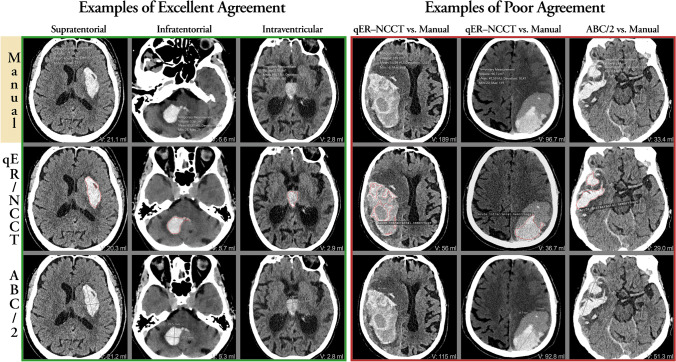
Fig. 2.
The top row shows the outline of the manual segmentation (gold standard); the middle row shows the outline of the qER–NCCT software; and the bottom row shows the A and B diameters of the ABC/2 measurement method. The volume of each measurement is shown in the bottom right corner of each image. The left 3 columns show typical cases with excellent agreement with supra-, infratentorial, and intraventricular locations, respectively. The fourth and fifth columns illustrate two typical cases of large heterogenous lobar ICH where the qER–NCCT software has delineated only the most hyperintense portions of the hematomas, thereby underestimating the total ICH volume. The sixth column illustrates a heterogenously shaped ICH where the ABC/2-method overestimates the hematoma volume, whereas the agreement between the qER–NCCT software and manual segmentation is excellent

