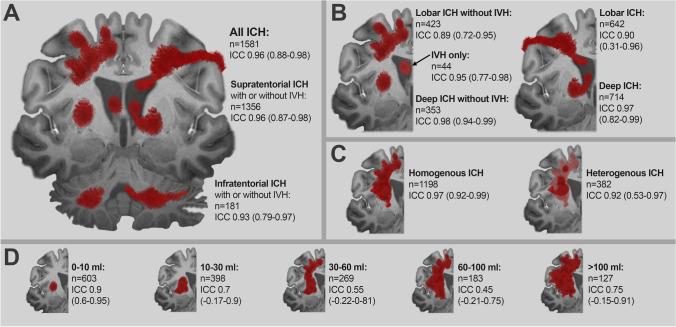
Fig. 3.
Illustration of the agreement between manual segmentation (gold standard) and the qER–NCCT software as measured by ICC for the various ICH subgroups. Panel A shows the agreement for all ICH and for supra- and infratentorial ICH separately. Panel B shows the agreement for lobar and deep supratentorial ICH. The left part shows the agreement for lobar and deep ICH without IVH and for IVH only. The right part shows the agreement for all lobar and deep ICH, regardless of IVH or not. Panel C shows the agreement for homogenous ICH and heterogenous ICH separately. Panel D shows the agreement grouped for different ICH volumes

