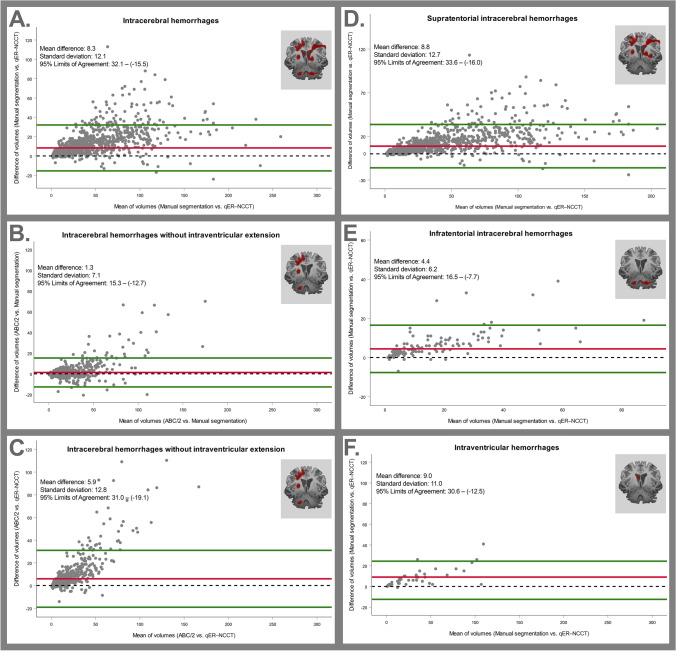
Fig. 4.
Top row shows Bland–Altman plots comparing the different volumetric measurement methods (manual segmentation, the qER–NCCT software and the ABC/2 method). Panel A shows the agreement between manual segmentation (gold standard) and the qER–NCCT software for all ICH. Panel B shows the agreement between manual segmentation (gold standard) and the ABC/2 method for ICH without IVH. Panel C shows the agreement between the ABC/2 method (gold standard) and the qER–NCCT software for ICH without IVH. Bottom row shows Bland–Altman plots for the agreement between manual segmentation (gold standard) and the qER–NCCT software for all supratentorial ICH (panel D), all infratentorial ICH (panel E) and for IVH only (panel F), respectively. The mean differences, the standard deviation, and 95% limits of agreement are shown in each plot

