Fig. 6.
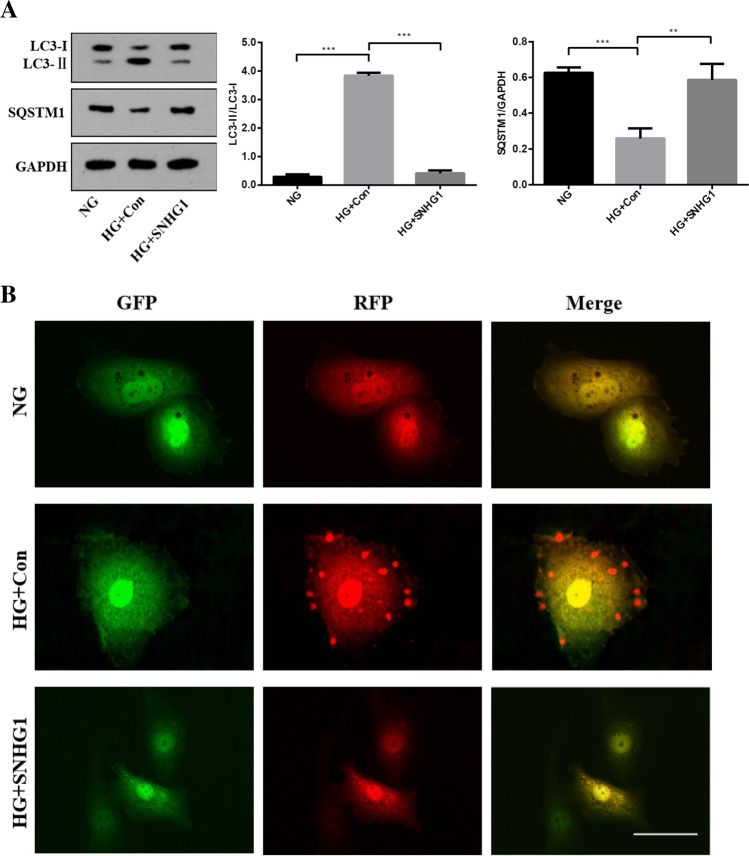
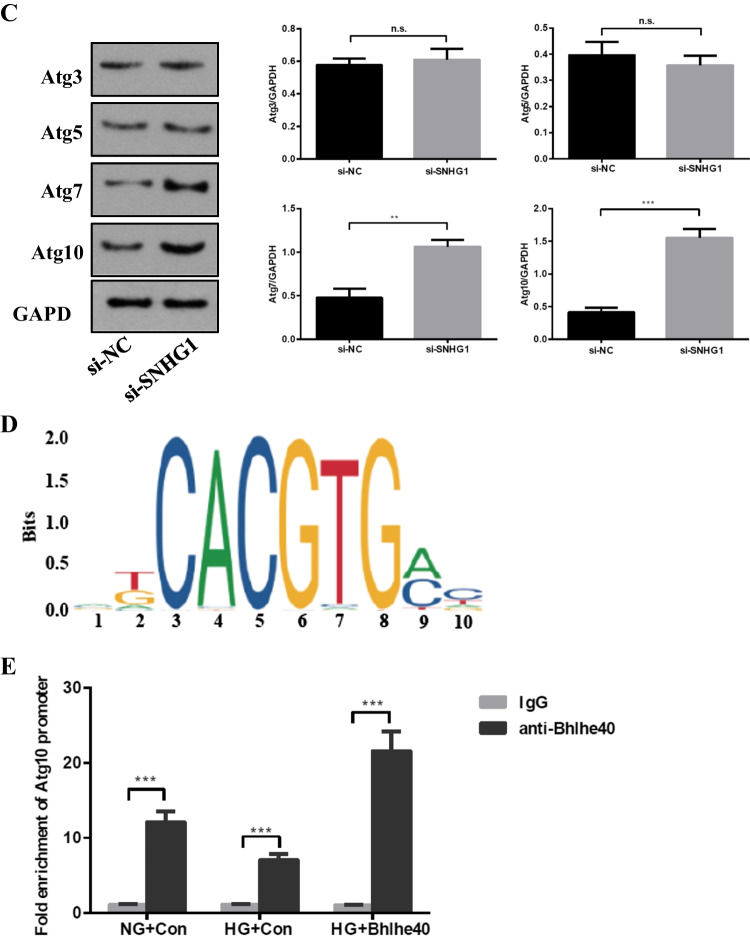
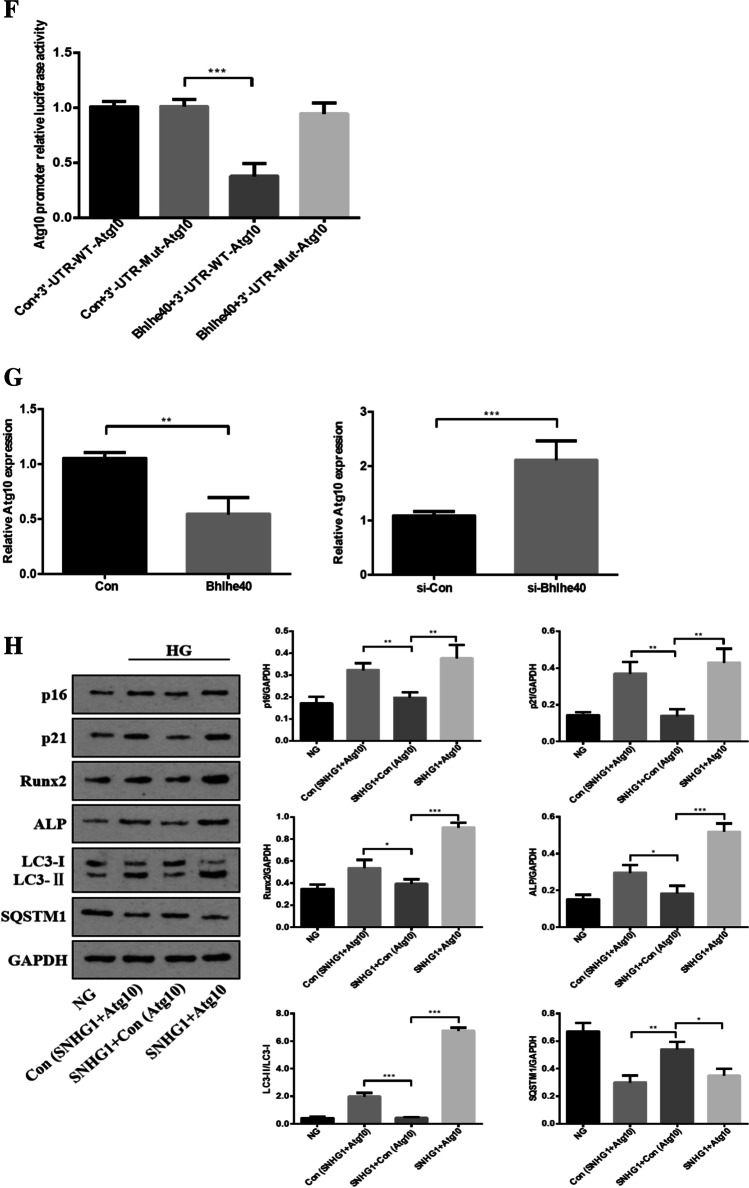
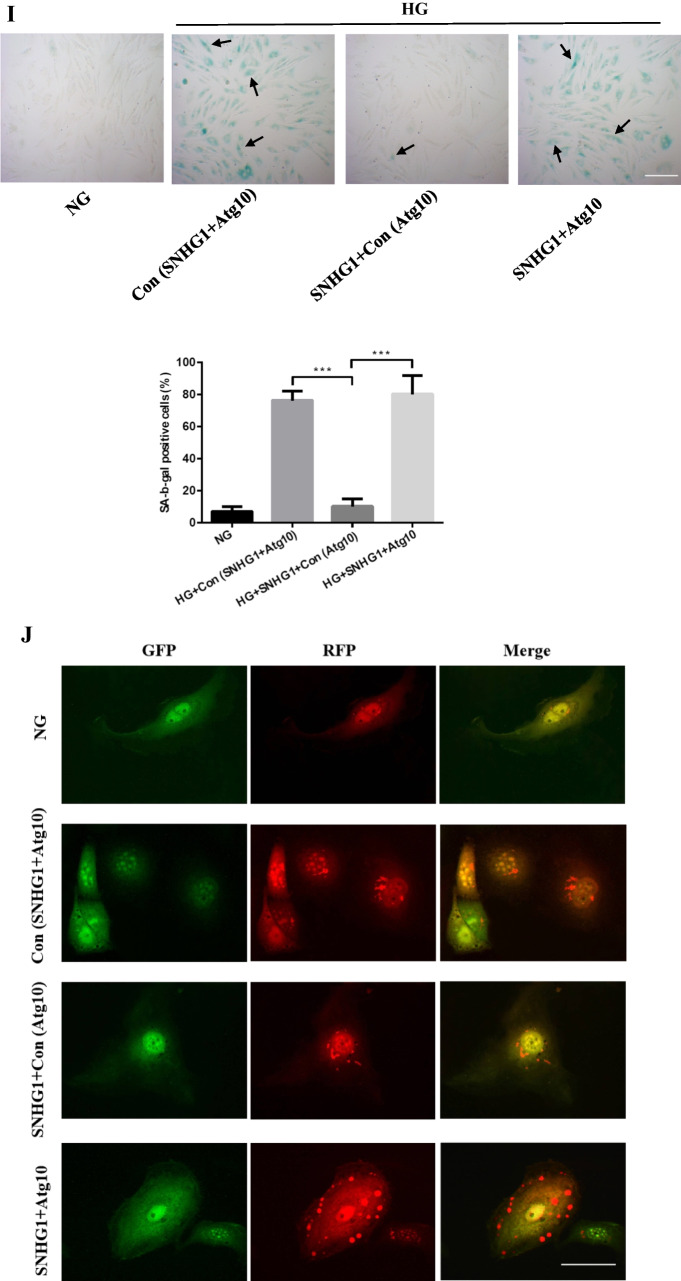
SNHG1 regulates Bhlhe40 mediated Atg10 transcription inhibition. A Western blot was performed to detect the levels of autophagy markers in HA-VSMCs after transfection with pcDNA3.1-SNHG1. B mRFP-GFP-LC3 distribution in HA-VSMCs transfected with mRFP-GFP-LC3 and pcDNA3.1-SNHG1 were analyzed by confocal microscopy (200 × magnification), scale bar = 100 µm. C The protein levels of Atg3, Atg5, Atg7 and Atg10 were measured in HA-VSMCs after transfection of si-SNHG1 by Western blot. D The binding sites of Bhlhe40 on Atg10 promoter region and the binding sequence was obtained using the JASPAR website. E ChIP assays were performed to verify the reliability of the binding sequence of Bhlhe40 on Atg10 promoter region. F HA-VSMCs were transfected with luciferase reporter carrying WT-pGL3-Atg10 or Mut-pGL3-Atg10 and cotransfected with the adenovirus vector expressing Bhlhe40 (Bhlhe40) or not (Con). Firefly luciferase values, normalized for Renilla luciferase, are presented. G qRT-PCR analysis of Atg10 in HA-VSMCs transfected with the adenovirus vector expressing Bhlhe40 or si-Bhlhe40. H HA-VSMCs were transfected with Atg10 overexpression plasmid (Atg10) or negative control (Con), respectively. Then, p16, p21, Runx2, ALP, LC3-II, and SQSTM1 protein levels were measured. I Representative images of SA-β-gal staining in the above four groups; semiquantitative analysis of SA-β-gal-positive cells was performed using Image J (200 × magnification); the blue area indicated by the arrow is the positive staining of SA-β-gal, scale bar = 100 µm. J mRFP-GFP-LC3 distribution in HA-VSMCs transfected with mRFP-GFP-LC3, pcDNA3.1-SNHG1 and Atg10 overexpression plasmid were analyzed by confocal microscopy (200 × magnification), scale bar = 100 µm. Results shown are means ± SD from triplicate experiments


