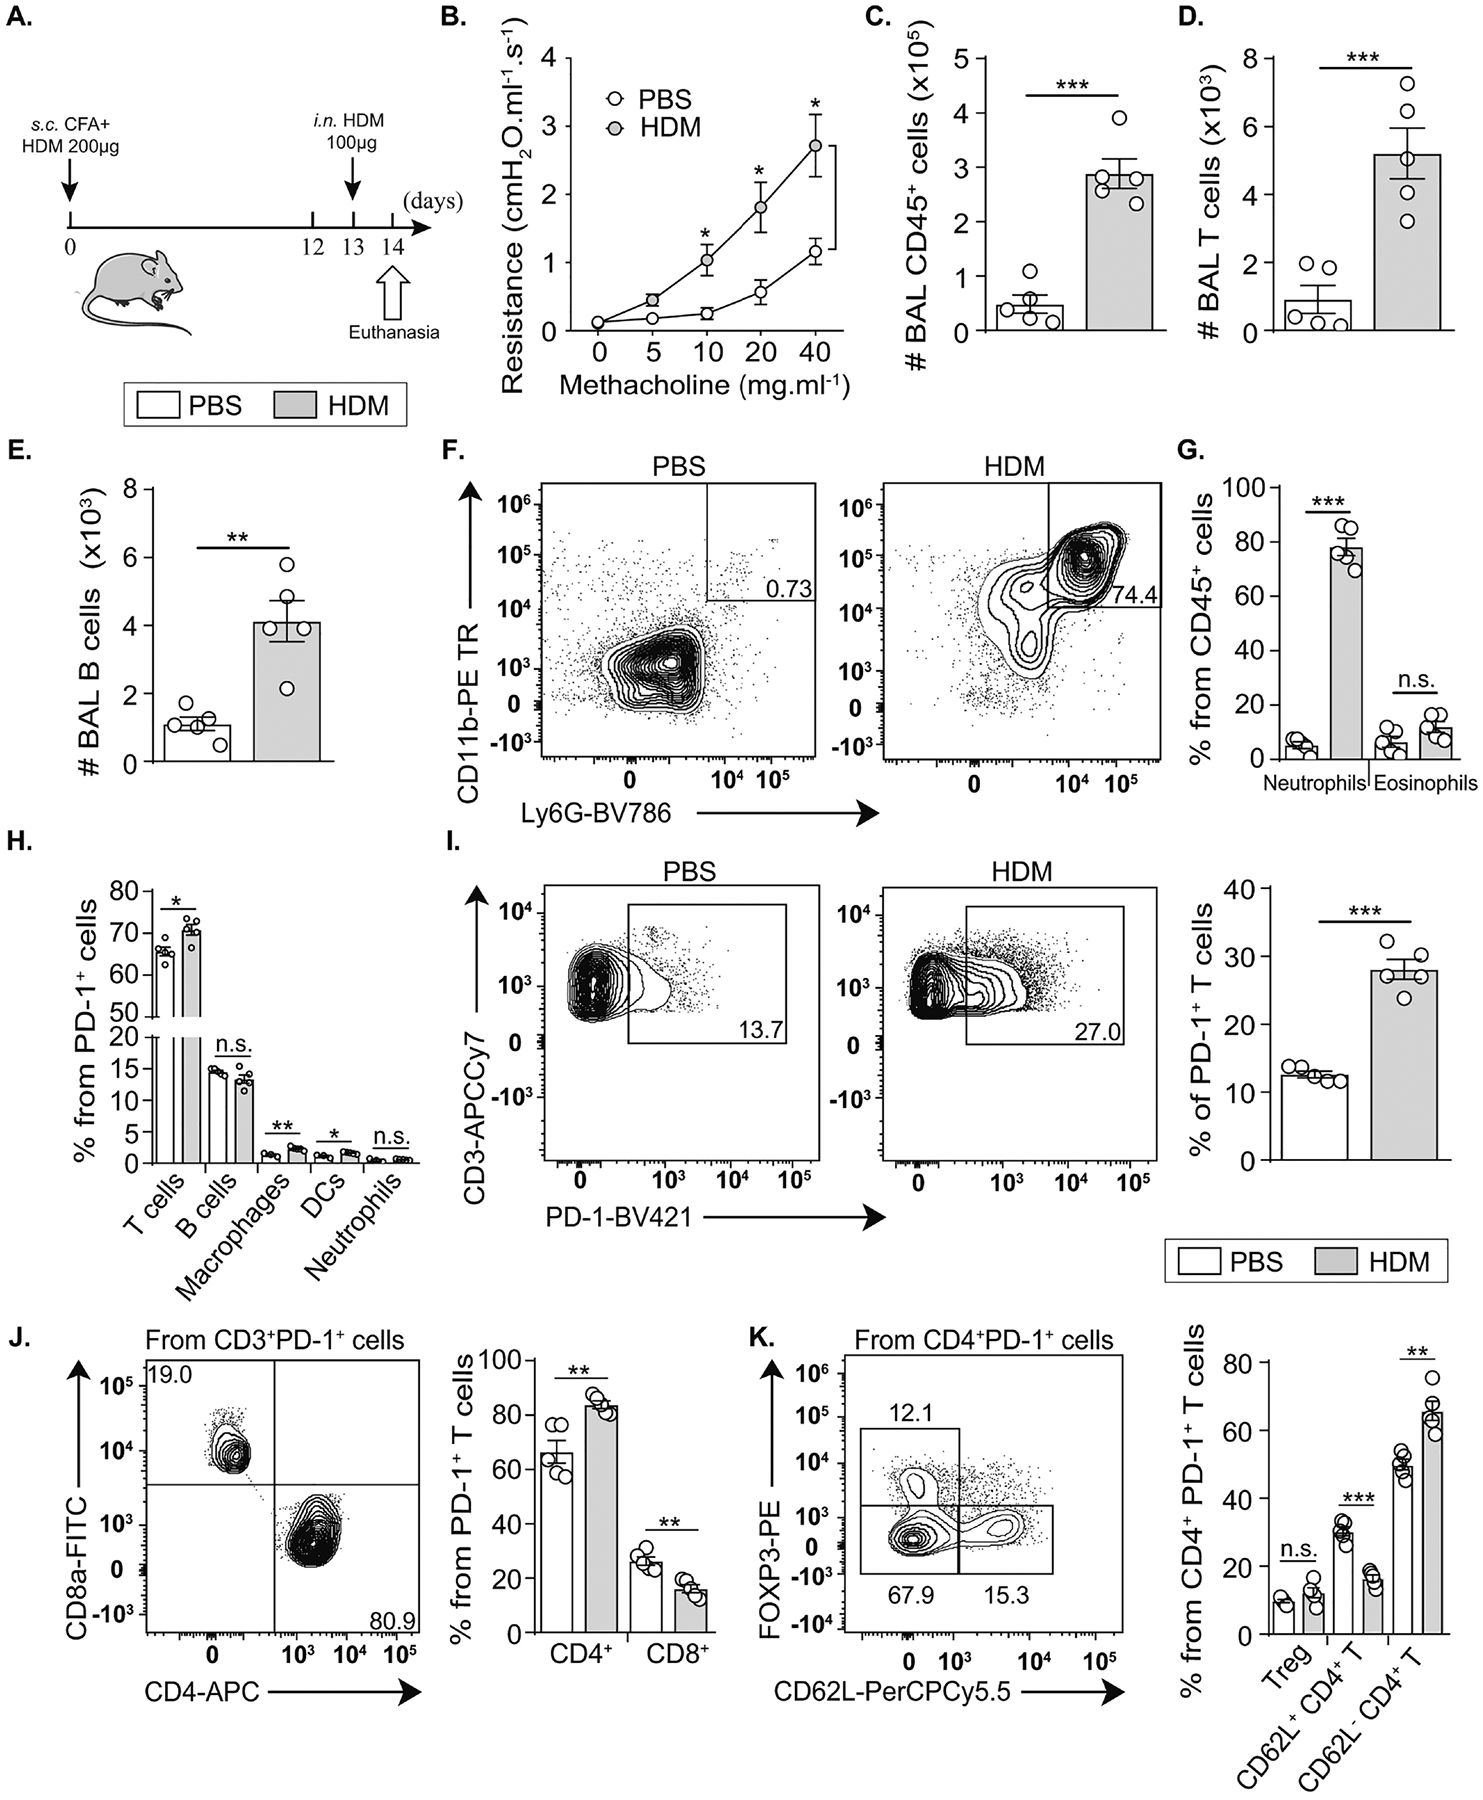
Figure 1: Neutrophilic inflammation is associated with PD-1 induction in lung immune cells.

(A) BALB/cByJ mice (WT) mice were sensitized via subcutaneous (s.c.) tail base injection of HDM (200 μg) mixed in CFA (1:1 v/v). After 13 days, mice were intranasally (i.n.) challenged with HDM (100 μg). On day 14, lung resistance was measured before euthanasia, BAL collection and lung processing.
(B) Variations in lung resistance measured in restrained ventilated mice.
(C) Total number of CD45+ cells, (D) CD3+ T lymphocytes and (E) B lymphocytes.
(F) Representative flow cytometry plots of neutrophils and (G) the quantification of lung neutrophils and eosinophils presented as the percentage among CD45+ cells.
(H) Composition of PD-1+ cells in the lung suspensions.
(I) Representative flow cytometry plots of PD-1 induction on CD3+ CD45+ cells and the corresponding quantification presented as the percentage of PD-1+ T cells in the lungs.
(J) Comparison between the percentage of CD4+ and CD8+ T cells expressing PD-1 in the lungs of HDM-treated mice within PD-1+ T cells.
(K) Composition of PD-1+ CD4+ T cells according to FOXP3 and CD62L markers.
Data are representative of at least 2 independent experiments and are presented as means ± SEM (two-tailed Student’s t-test; n=5).
