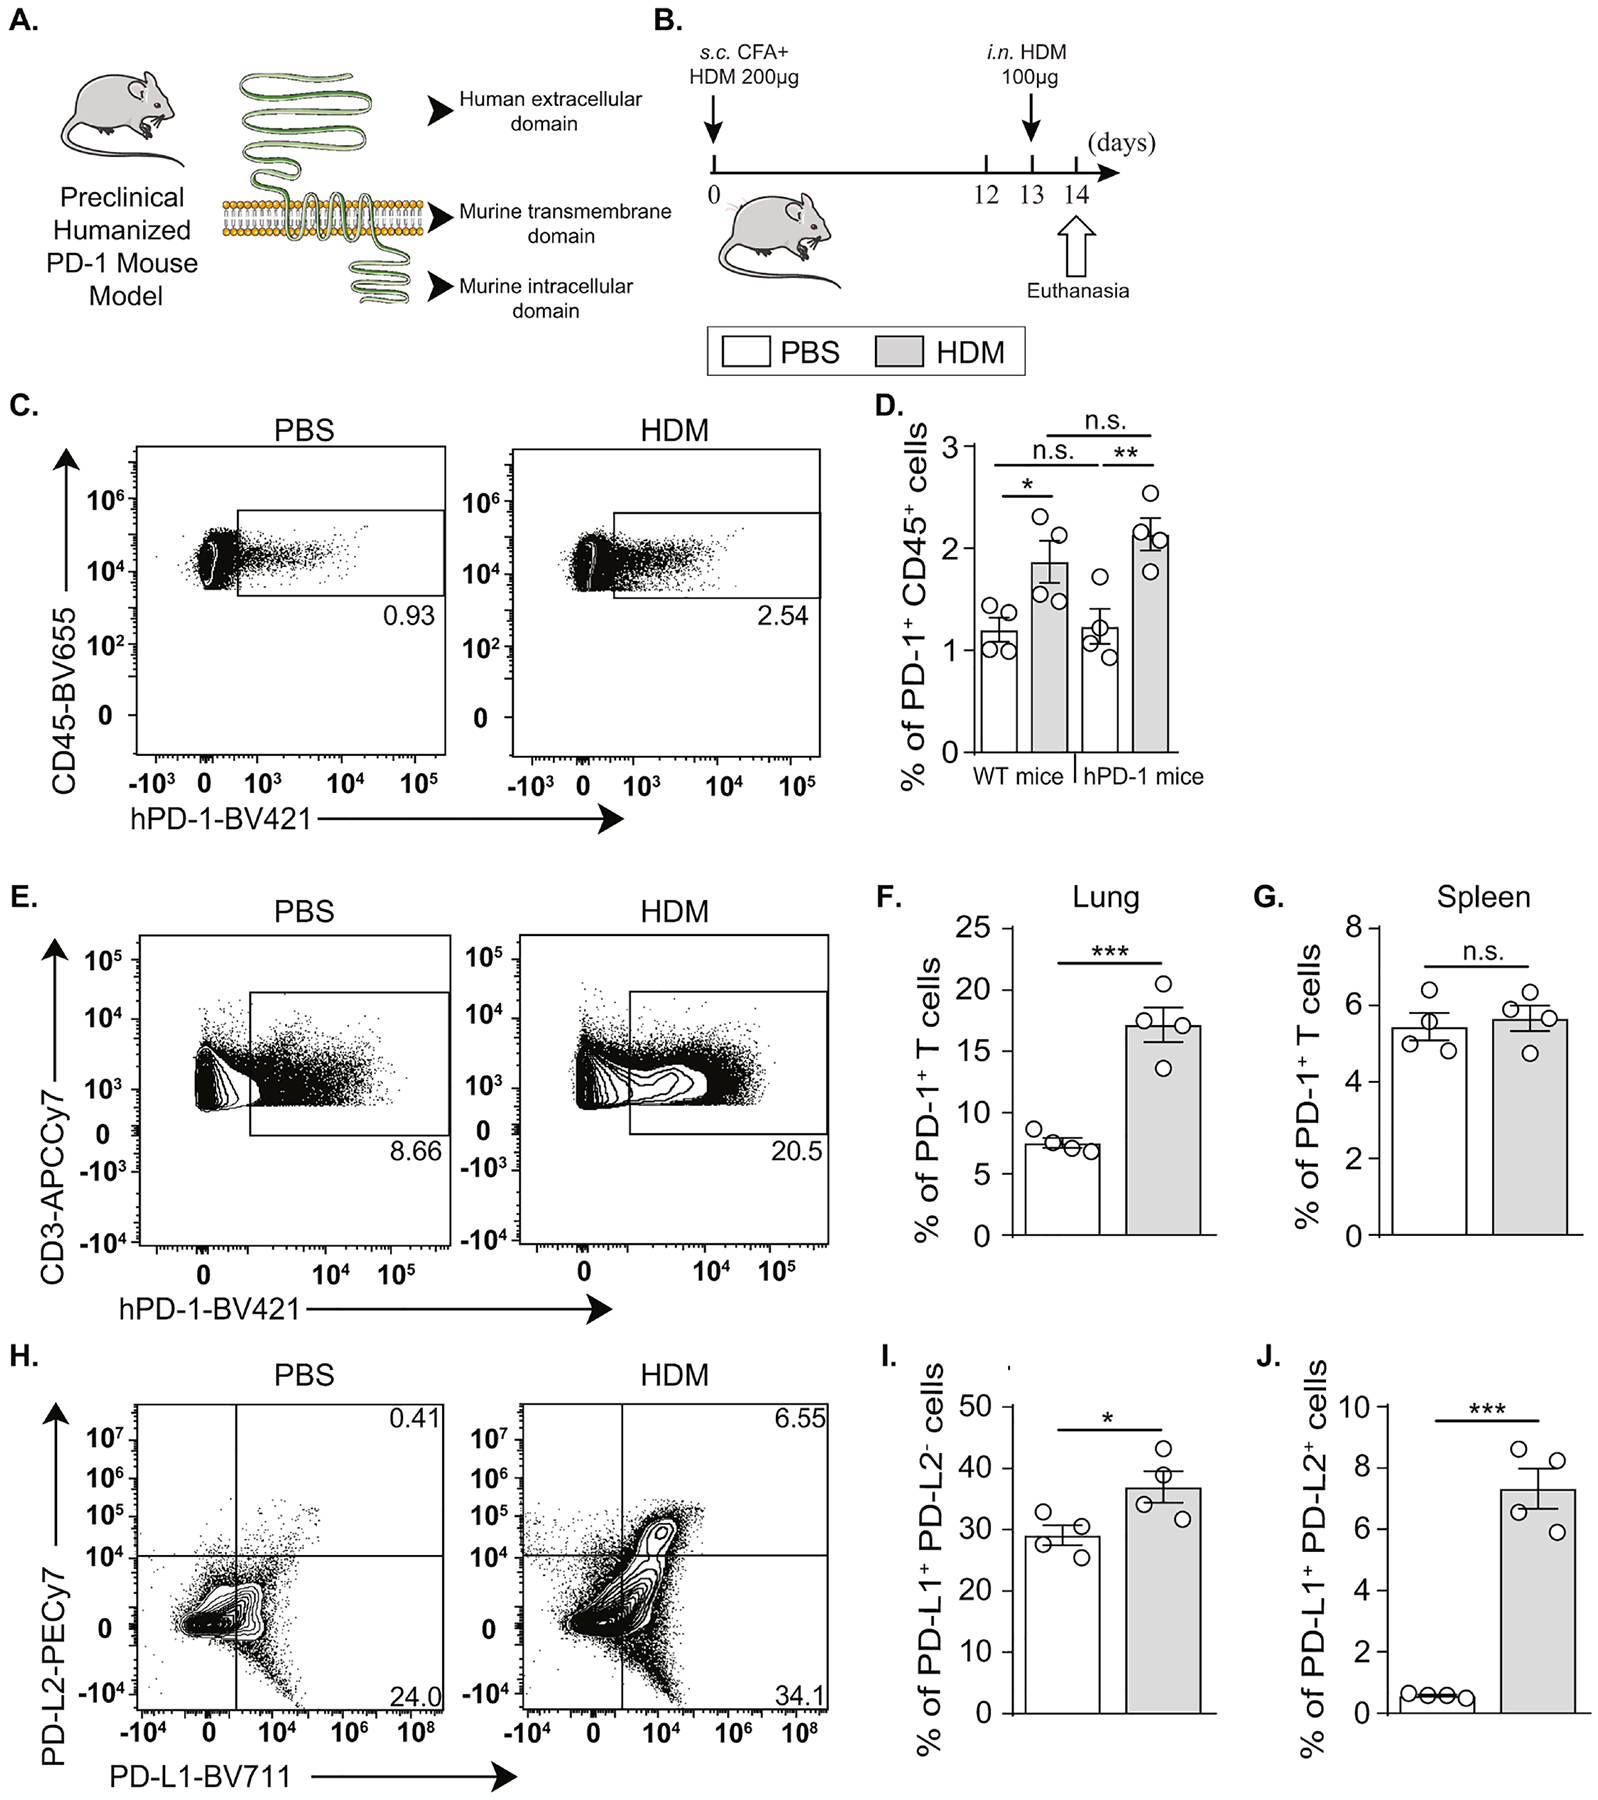
Figure 3: PD-1 axis is comparably induced in humanized PD-1 mice and WT mice following HDM challenge.

(A) Representation of extracellular, transmembrane, and intracellular domains of PD-1 in hPD-1 mouse.
(B)hPD-1 mice were sensitized via s.c. tail base injection of HDM (200 μg) mixed in CFA (1:1 v/v). After 13 days, mice were i.n. challenged with HDM (100 μg). On day 14, lung and spleen processing followed euthanasia.
(C) Representative flow cytometry plots of human PD-1 induction on CD45+ cells from hPD-1 mice.
(D) PD-1+ CD45+ cell percentage in the lungs of WT and hPD-1 mice following HDM challenge.
(E) Representative flow cytometry plots of human PD-1 induction on CD3+ cells and (F) the corresponding quantification presented as the percentage of PD-1+ T cells in the lungs of hPD-1 mice.
(G) Percentage of PD-1+ T cells in the spleens of hPD-1 mice.
(H) Representative flow cytometry plots of PD-L1 and PD-L2 induction on CD45+ cells and
(I) the corresponding quantification presented as the percentage of PD-L1+ PD-L2− cells and (J) PD-L1+ PD-L2+ cells in the lungs of hPD-1 mice.
Data are representative of at least 2 independent experiments and are presented as means ± SEM (two-tailed Student’s t-test; n=4).
