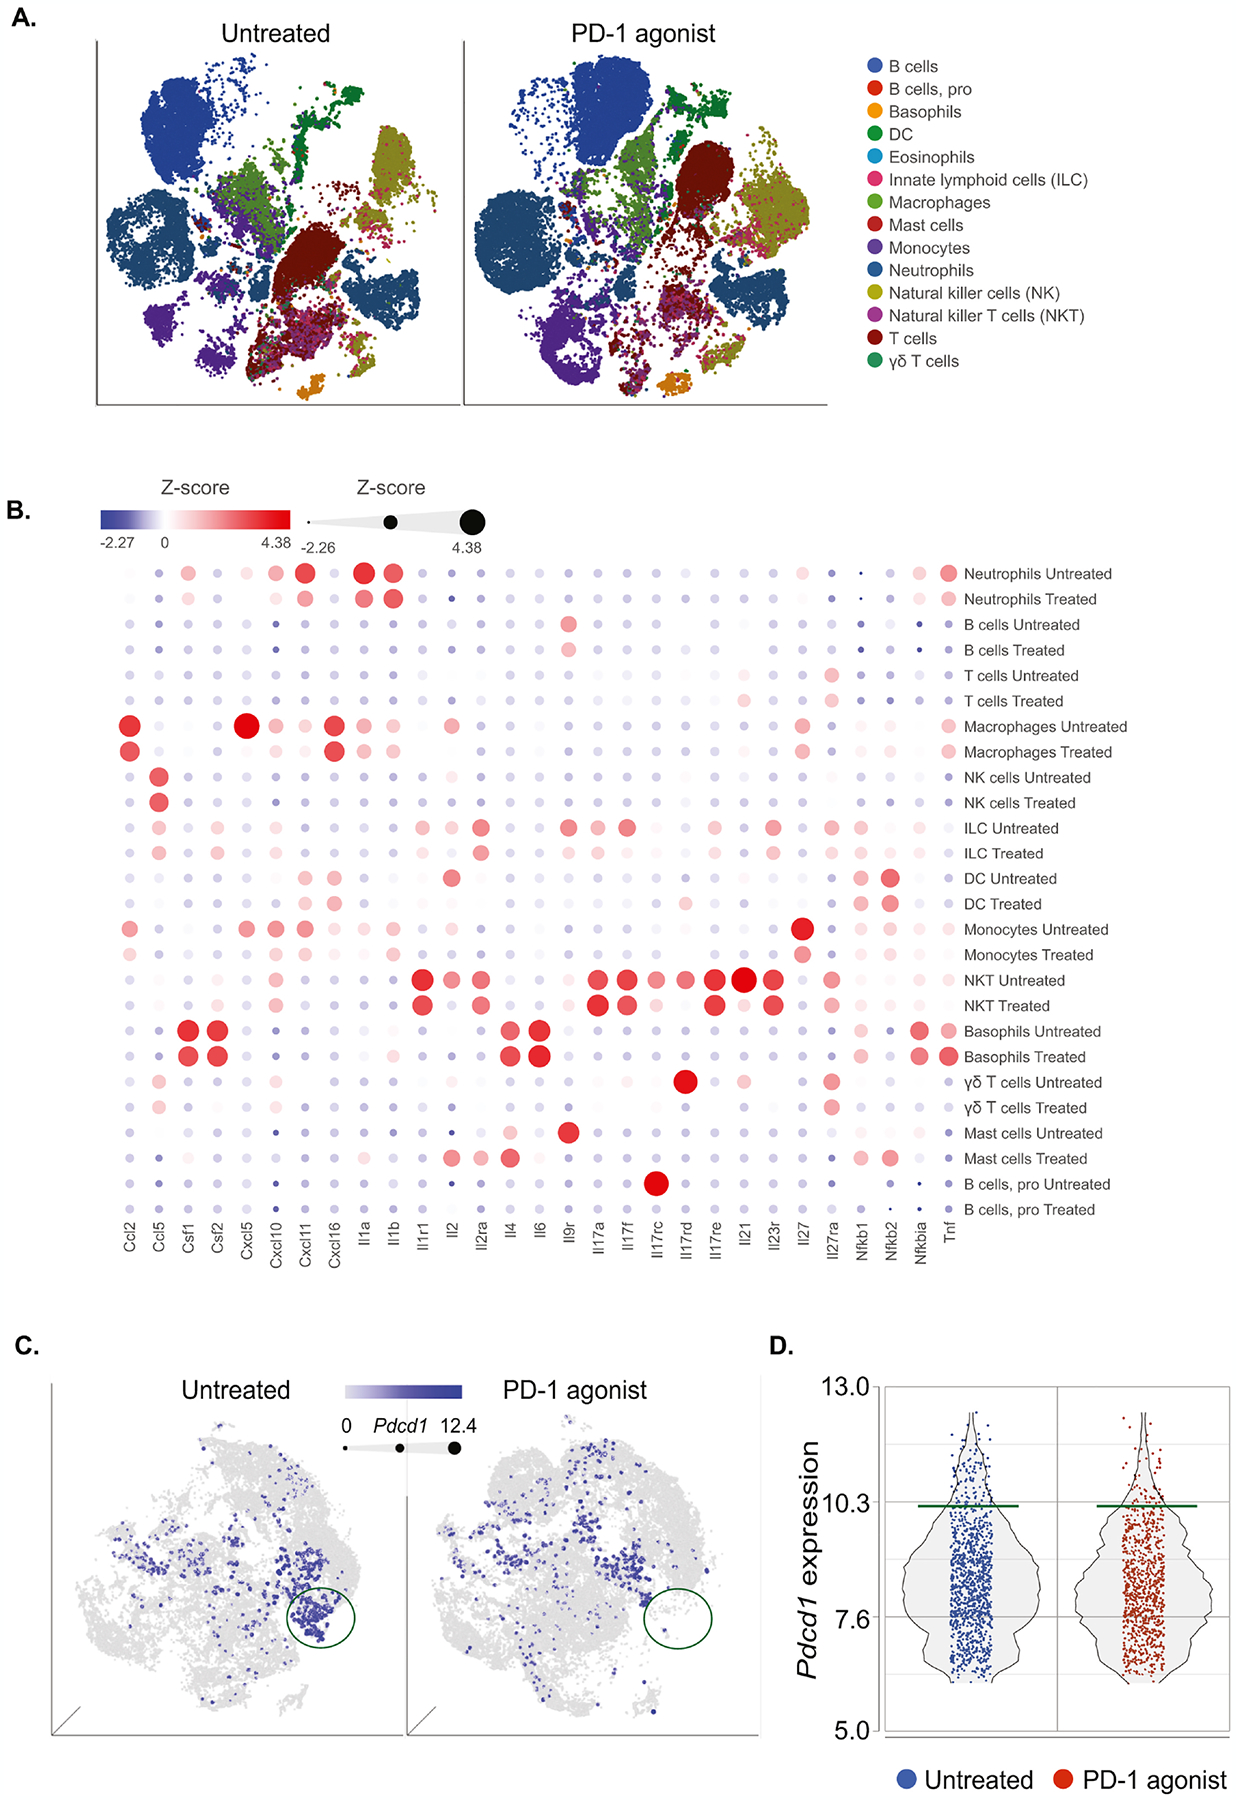
Figure 5: scRNAseq analysis reveals the impact of PD-1 agonist treatment on the lung immune landscape.

Single-cell RNA-seq was performed on sorted CD45+ cell suspensions pooled from 3 lungs per group (isotype- versus PD-1 agonist- treated mice). Samples were analyzed using Partek Flow genomic analysis software.
(A) tSNE plot (2D graph) revealing the effect of PD-1 agonist on main immune cell populations annotated using SingleR.
(B) Bubble heatmap showing the expression of relevant genes implicated in cytokine pathways.
(C) tSNE plot (3D graph) of CD45+ cells colored by Pdcd1 expression. The intensity of the blue color, as well as the dot size, are dependent on the level of Pdcd1 expression. Green circles represent a cluster of Pdcd1+ high cells.
(D) Dot plot showing the intensity of Pdcd1 expression in total CD45+ lung cells.
