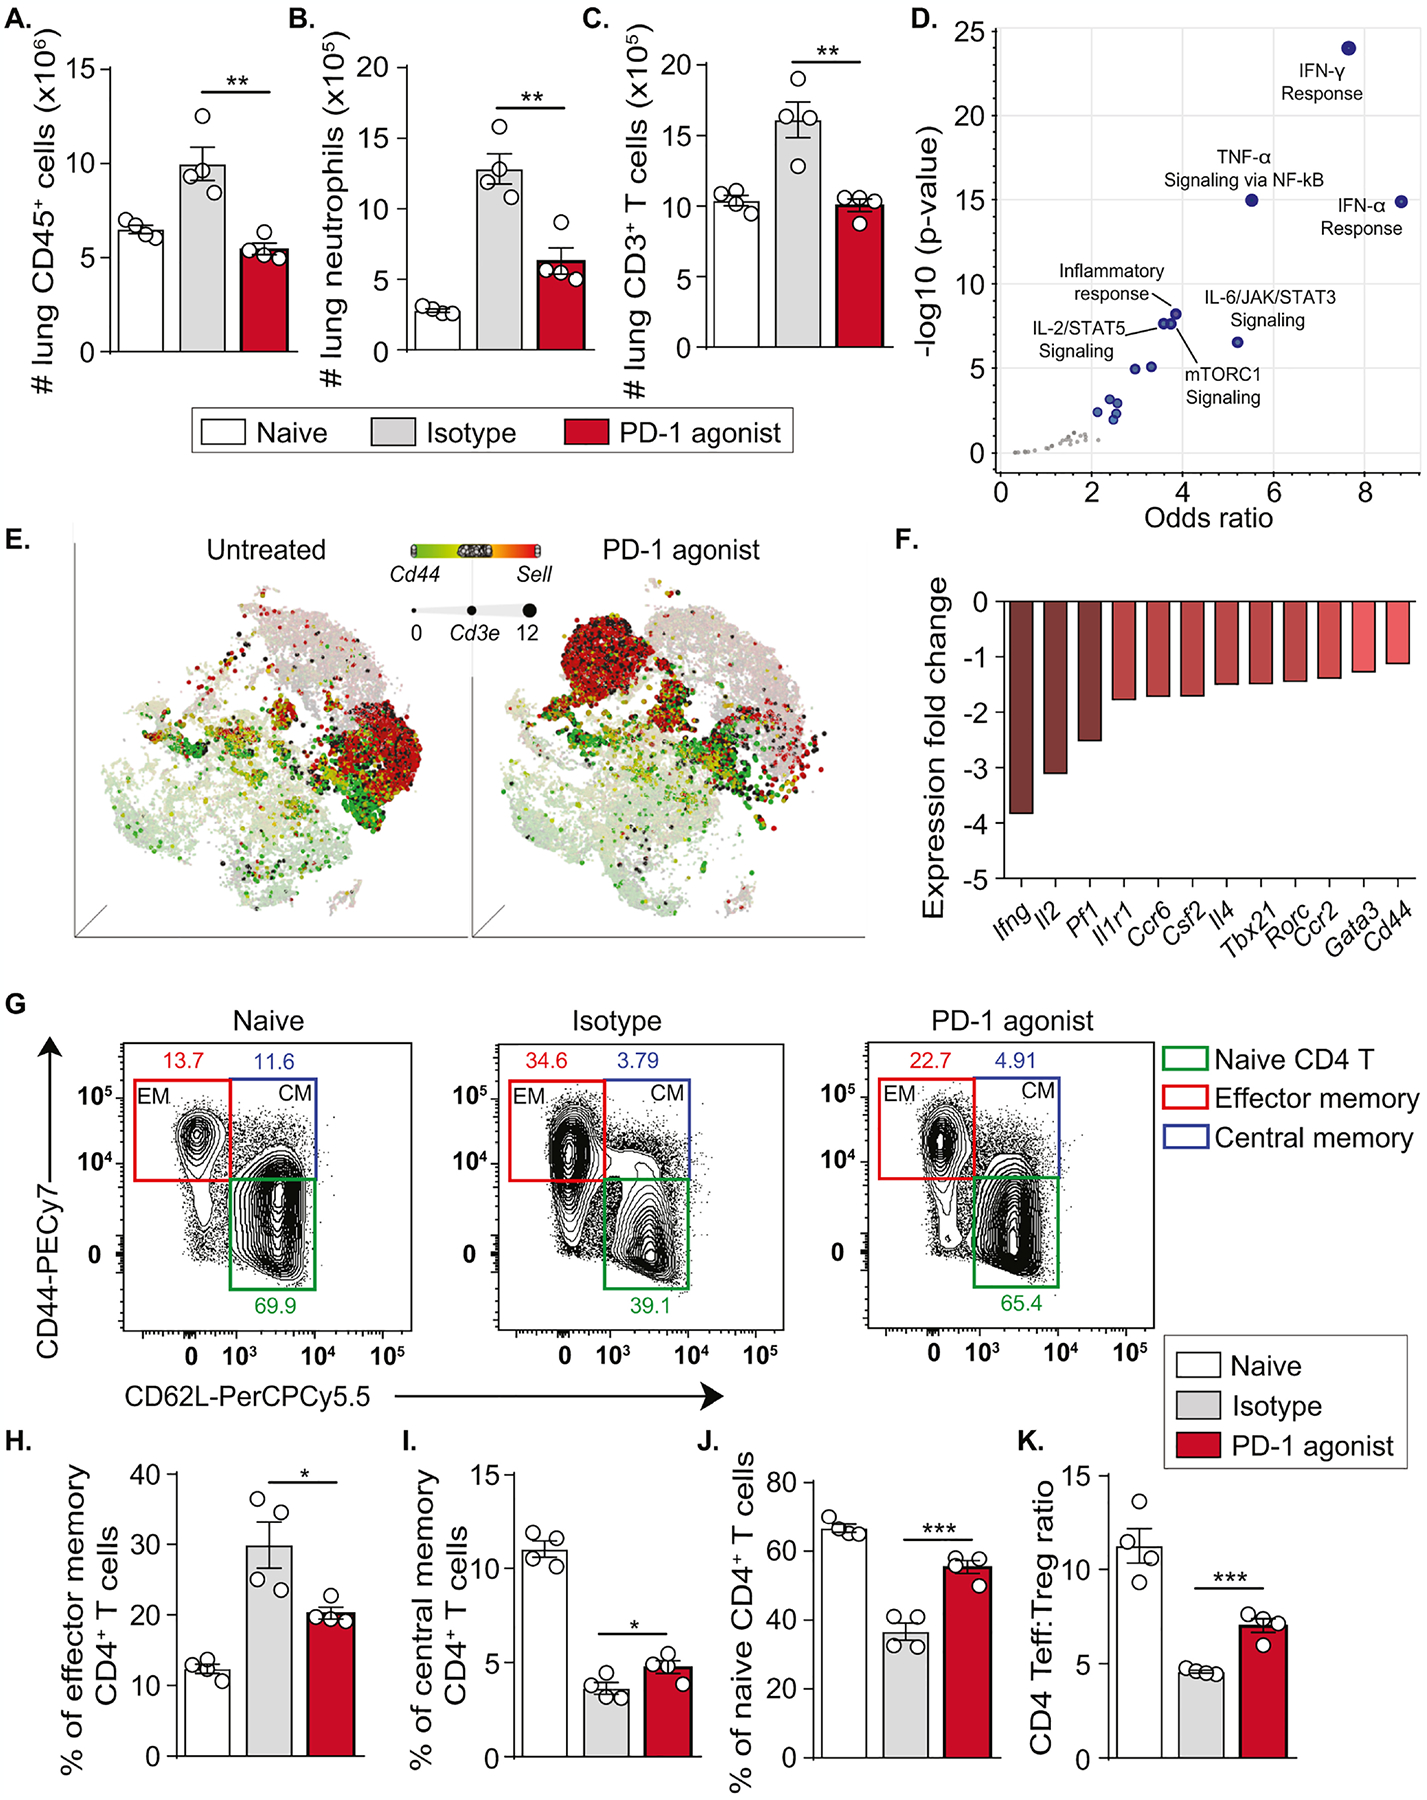
Figure 6: PD-1 agonist treatment downregulates the effector phenotype of lung T cells.

Following the induction of neutrophilic lung inflammation, humanized PD-1 mice received two injections of the PD-1 agonist or the corresponding isotype, as previously described. On day 15, lungs were washed and collected after euthanasia.
(A) Absolute count of CD45+ cells, (B) neutrophils, (C) CD3+ T cells.
(D) Volcano plot showing significantly affected pathways in lung immune cells from PD-1 agonist-treated mice as compared to isotype-treated mice (MSigDB_Hallmark_2020 gene set).
(E) tSNE plot representation based on the expression of Cd44 and Sell genes in lung immune cells. The size of dots is dependent on the level of Cd3e expression.
(F) Expression of genes related to the T effector phenotype expressed as fold change (PD-1 agonist vs isotype group).
(G) Representative flow cytometry plots showing the gating strategy for the identification of CD4+ T cells subsets according to CD44 and CD62L expression.
(H) Percentages of effector memory CD4+ T cells, (I) central memory CD4+ T cells, (J) naïve CD4+ T cells, and (K) Teff:Treg ratio in the lungs.
Data are representative of at least 2 independent experiments and are presented as means ± SEM (two-tailed Student’s t-test; n=4).
