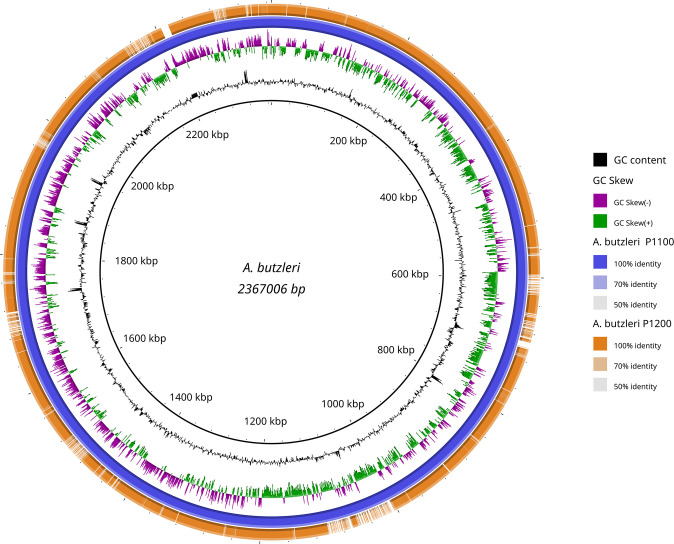
Figure 3.
Blast Ring Image Generator (BRIG) generated graph depicting homologous chromosome segments of A. butzleri P1100 (reference) and P1200. A. butzleri P1100 was chosen as reference (inner black circle) and is additionally shown in the second outer circle (blue). The outermost orange ring shows the homology of A. butzleri P1200 compared to A. butzleri P1100 based on BLASTn+ analysis. Additionally GC content (black) and genomic GC skew (purple/green) are also shown in the figure.

