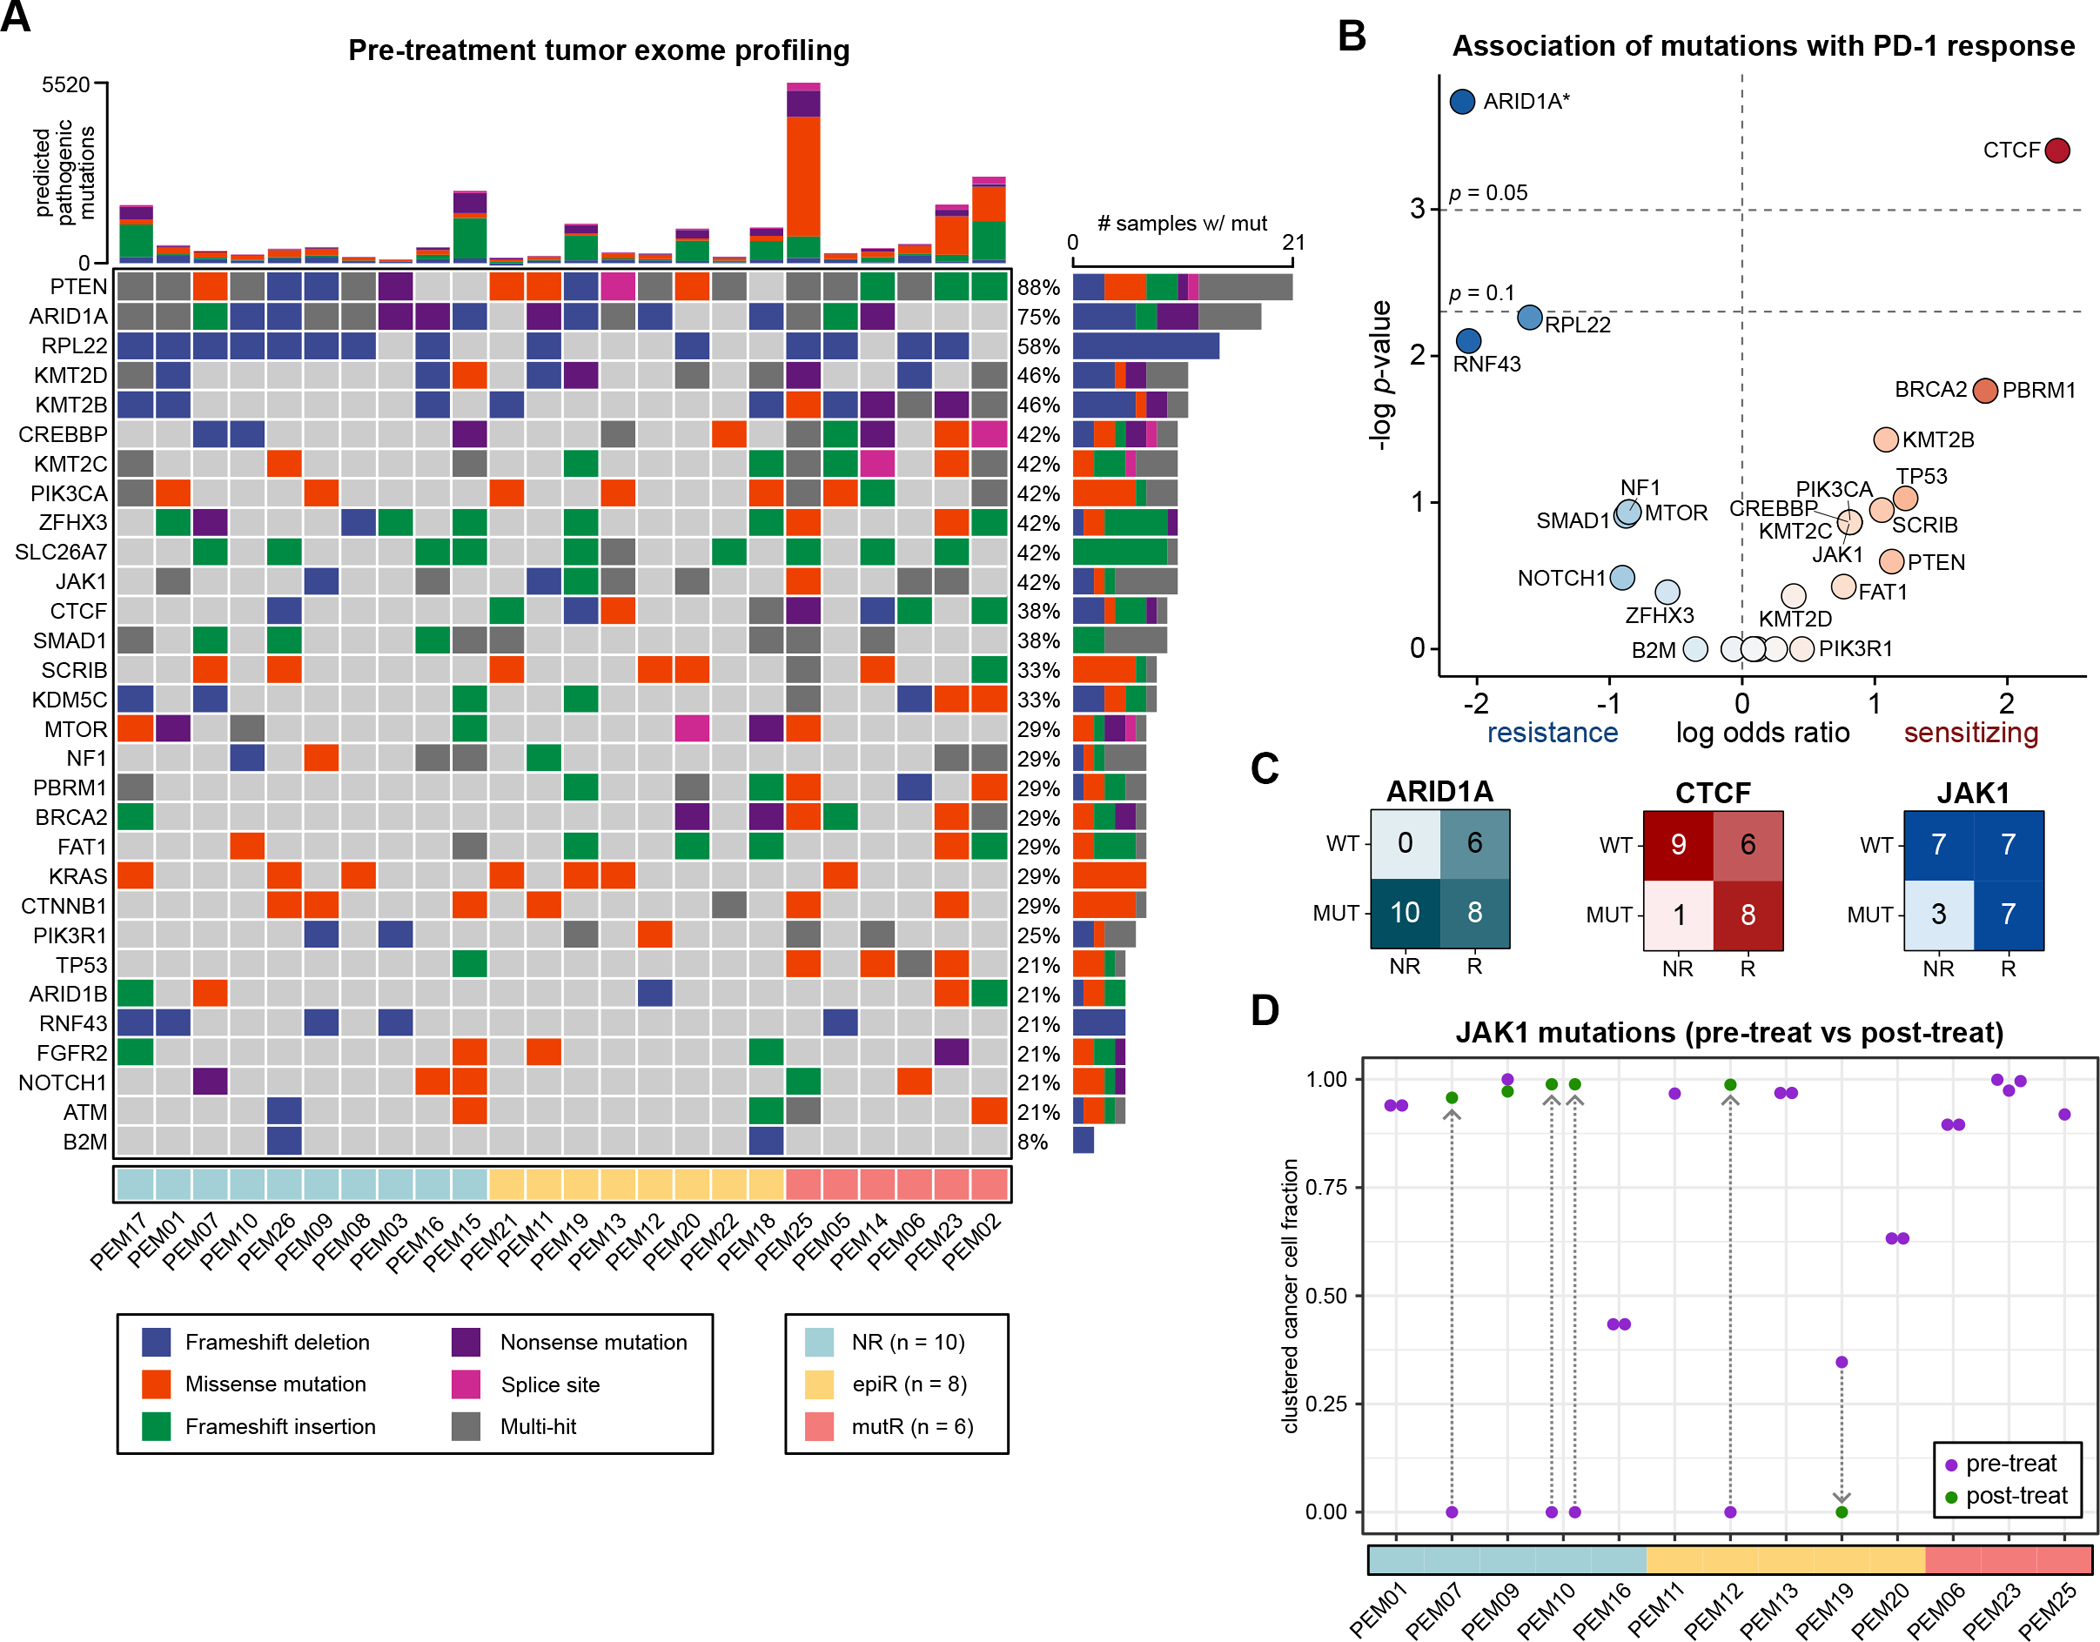
Figure 2: JAK1 mutations do not confer primary resistance to PD-1 checkpoint immunotherapy.

A. Mutation profiles of pre-treatment tumors, filtered for predicted pathogenic or deleterious mutations.
B. Association between individual mutations and response to PD-1 immunotherapy. Data are expressed as log odds ratios. A pseudocount was added for ARID1A, as all patients with non-mutant ARID1A responded to ICB. Statistical significance was assessed by two-tailed Fisher’s exact test.
C. Association of ARID1A, CTCF and JAK1 mutations with PD-1 immunotherapy response.
D. JAK1-mutant cancer cell fractions (CCFs) in JAK1-mutant tumors, after clustering. Each point represents a unique JAK1 variant that was identified in a particular sample. Pre-treatment CCFs are annotated in purple, while post-treatment CCFs are in green, with arrows connecting the same variant across timepoints.
