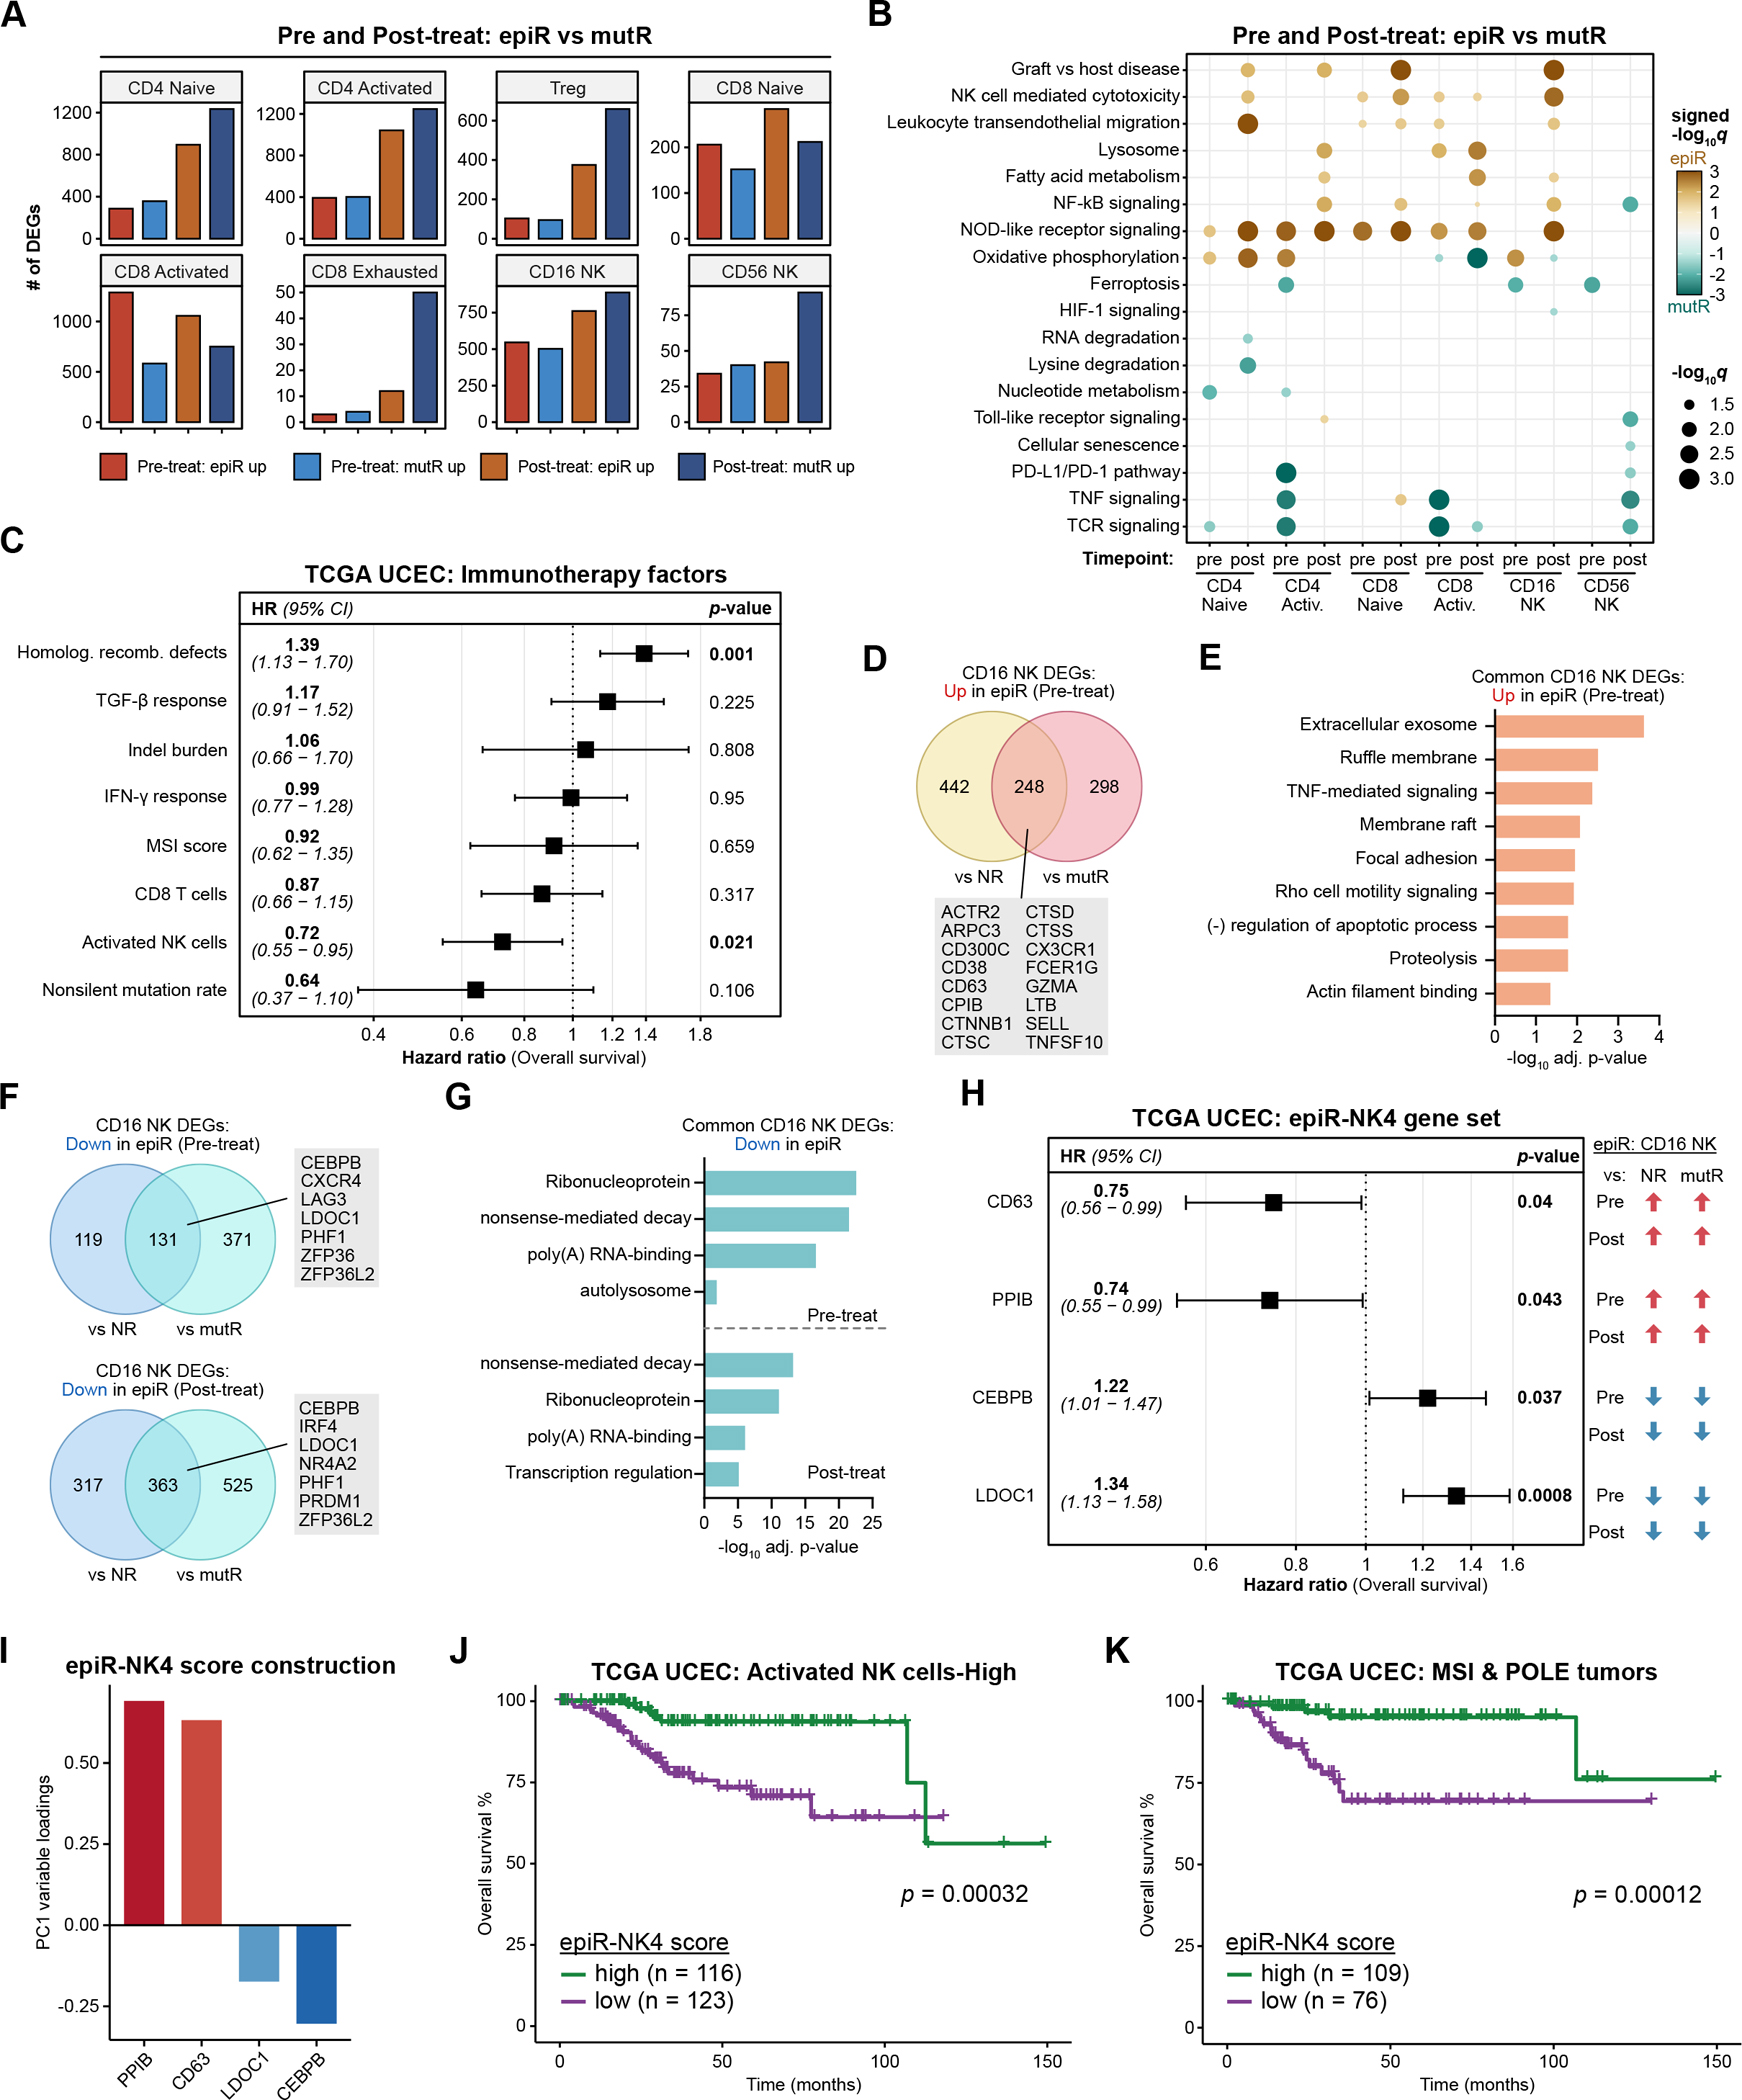
Figure 4: Transcriptional features of NK cells in epi-MMRd responders are associated with survival.

A. The number of DEGs in T and NK cell populations when comparing epiR vs. mutR patients, before or after PD-1 immunotherapy.
B. Dot plots detailing significantly upregulated or downregulated pathways in each of the cell types, comparing epiR patients to mutR patients, before or after PD-1 immunotherapy. Statistical significance was assessed by hypergeometric test with Benjamini-Hochberg multiple hypothesis correction, visualized as signed −log10 q-values.
C. Forest plot detailing the results of a multivariable Cox proportional hazards model for overall survival in the TCGA UCEC cohort, examining several factors previously associated with response or resistance to ICB immunotherapy.
D-E. Venn diagram (D) and gene ontology enrichment analysis (E) of DEGs in CD16+ NK cells that are significantly upregulated in epiR patients compared to NR or mutR patients, before PD-1 immunotherapy. Statistical significance in (E) was assessed by hypergeometric test with Benjamini-Hochberg multiple hypothesis correction.
F-G. Venn diagram (F) and gene ontology enrichment analysis (G) of DEGs in CD16+ NK cells that are significantly downregulated in epiR patients compared to NR or mutR patients, before (upper panel) or after PD-1 immunotherapy (lower panel). Statistical significance in (G) was assessed by hypergeometric test with Benjamini-Hochberg multiple hypothesis correction.
H. Forest plot detailing the results of a multivariable Cox proportional hazards model for overall survival in the TCGA UCEC cohort, examining a set of four genes (epiR-NK4) that were consistently upregulated (CD63, PPIB) or downregulated (CEBPB, LDOC1) in CD16+ NK cells from epiR patients. These four genes were selected through Lasso regression from a total of 111 genes that were concordantly upregulated or downregulated in CD16+ NK cells from epiR patients.
I. Variable loadings for the first principal component (PC1) of the TCGA UCEC dataset, based on expression levels of the epiR-NK4 gene set.
J-K. Kaplan-Meier survival analysis of the TCGA UCEC cohort, subsetted on tumors with a high activated NK cell score (J) or tumors annotated as MSI-H/POLE-hypermutated (K). Patients were stratified by their epiR-NK4 scores, corresponding to PC1 of the epiR-NK4 gene set as in (I), and classifying into high and low groups based on the median score. Statistical significance was assessed by log-rank test.
