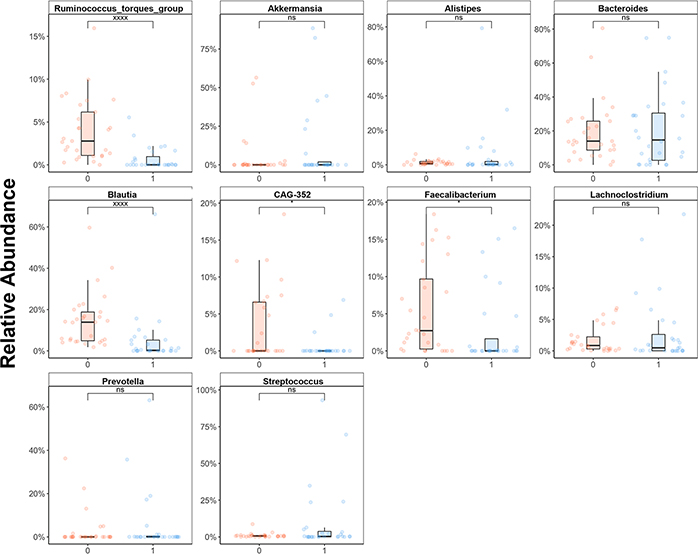
Figure 2: Relative Taxa Changes Pre/Post Transplant.
Relative abundance changes in top 10 abundant genera between pre-transplant (red, timepoint 0) and post-transplant engraftment (blue, timepoint 1) samples. NS: non-significant, *p value < 0.05, xxxx: p value <0.0005. Ruminococcus, Blautia, CAG-352, and Faecalibacterium demonstrated a statistically significant difference in abundance between timepoints.

