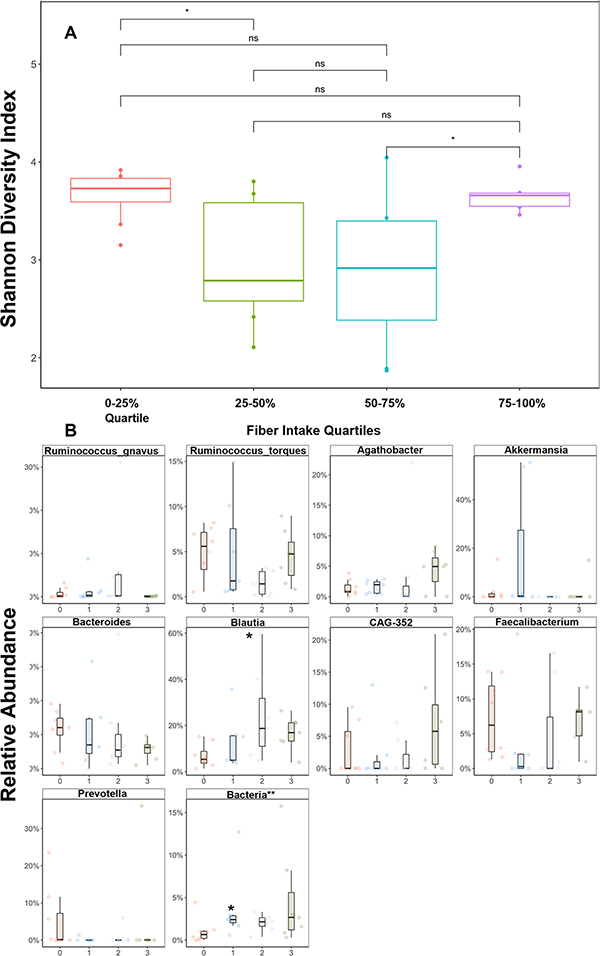
Figure 3: Effect of Fiber Intake on Gut Microbiome Community Structure.
(A) Boxplot depiction of Shannon alpha diversity index at pre-transplant timepoint according to fiber intake quartile. (B) Relative abundance changes in top 10 abundant genera between fiber quartiles (0: 0–25%, 1: 25–50%, 2: 50–75%, 3: 75–100%) at pre-transplant timepoint. *p<0.05. **corresponds to most approximate classification.

