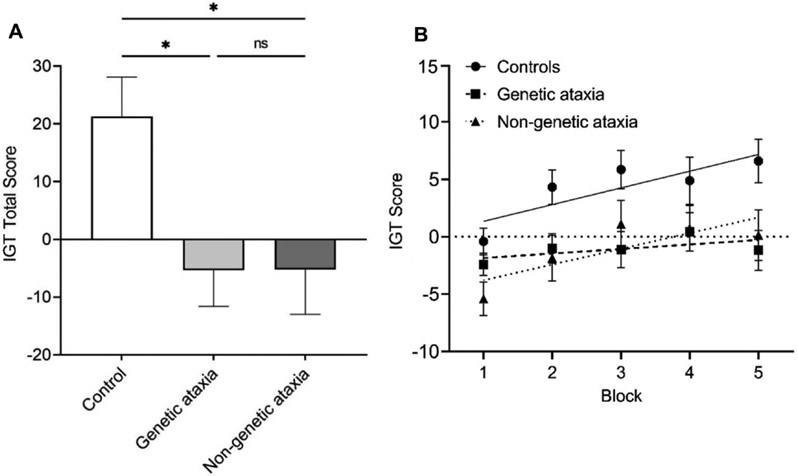
Figure 2. Comparison between genetic and non-genetic ataxia:
(A) IGT total scores in controls, participants with genetic CA, and participants with non-genetic CA. (B) Mean ± SEM of IGT scores throughout the five 20-trial blocks in controls, participants with genetic CA, and participants with non-genetic CA. Learning curves calculated through linear regression models. *p < 0.05, ns: not significant.

