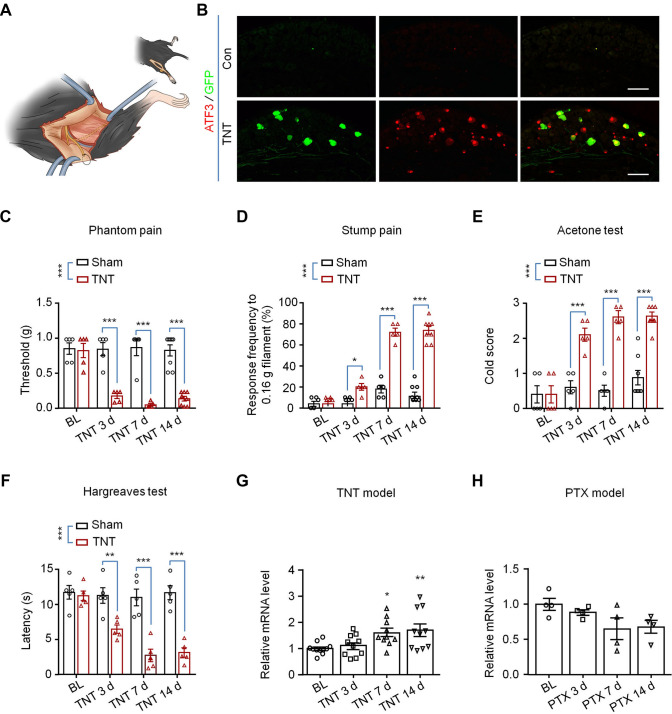
Fig. 3.
Generation and characterization of the TNT mouse model. A Schematic of the generation of the TNT mouse model. B IHC showing the expression of the neuronal injury marker ATF3 and NPY in NPY-Cre; Ai3 mice after TNT surgery (scale bars, 200 μm). C–F Behavioral tests of the TNT mouse model including phantom pain (C), n = 5–8, stump pain (D), n = 5–8, cold allodynia (E), n = 5–8, and heat hyperalgesia (F), n = 5. (*P <0.05, **P <0.01, ***P <0.001, two-way ANOVA). G qRT-PCR results for the expression of Tmem63a in the DRGs from TNT mouse models (n = 10–11; *P <0.05, **P <0.01, two-way ANOVA). H qRT-PCR results for the expression of Tmem63a in DRGs from chemotherapy (PTX) mouse models (n = 4; *P <0.05, one-way ANOVA).

