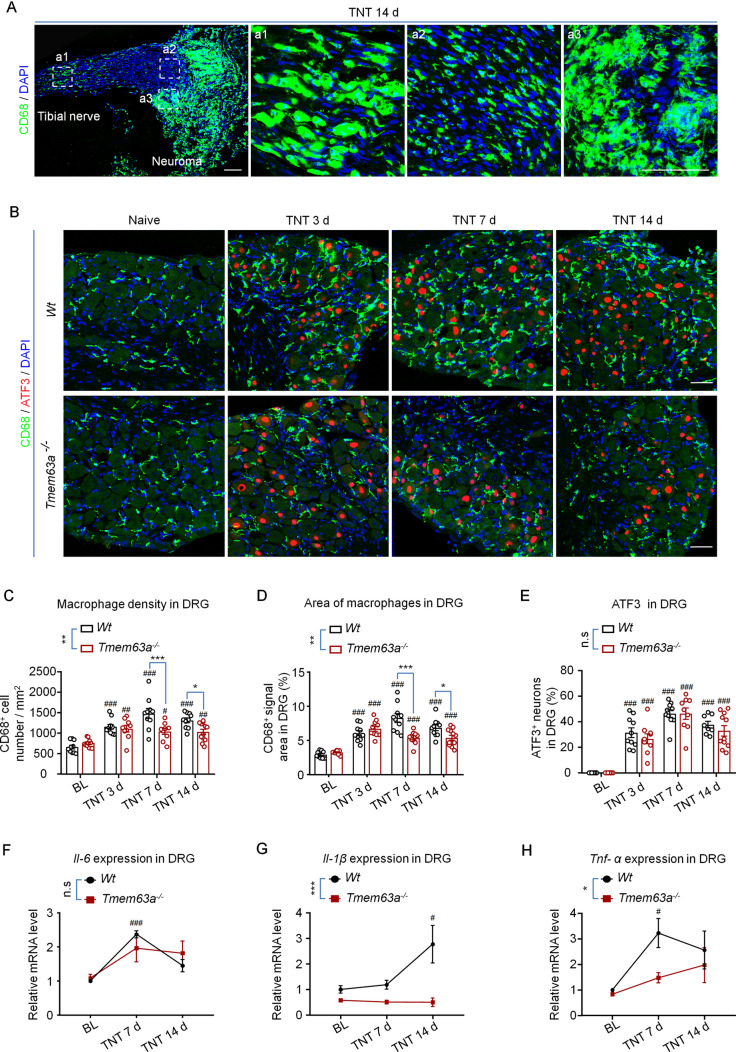
Fig. 6.
Macrophage infiltration and pro-inflammatory cytokine expression in the DRGs of Tmem63a–/– mice. A IHC images of macrophage (green) infiltration in the tibial nerve and neuroma-like structure 14 days after TNT surgery; a1, a2, and a3 are enlargements of the boxed areas in the left (blue, nuclei stained with DAPI; scale bars, 50 μm). B Double immunostaining for the molecular markers for macrophages (CD68, green) and nerve injury (ATF3, red) in DRG sections from WT and Tmem63a–/– mice after TNT surgery (blue, nuclei stained with DAPI; scale bars, 50 μm). C Quantification of macrophage density (cell number/mm2) in the DRGs from WT mice and Tmem63a-/- mice after TNT surgery (n = 9–11; #P <0.05, ##P <0.01, ###P <0.001, one-way ANOVA; *P <0.05, **P <0.01, ***P <0.001, two-way ANOVA). D Quantification of the average area of macrophages in DRG sections after TNT surgery (n = 9–12; ###P <0.01, one-way ANOVA; *P <0.05, **P <0.01, ***P < 0.001, two-way ANOVA). E Quantification of injured DRG neurons (n = 8–11; n.s, P >0.05, two-way ANOVA; ###P <0.001 one-way ANOVA). F–H qRT-PCR results for the expression of the pro-inflammatory factors Il-6, Il-1β, and Tnf-α in DRGs from WT mice and Tmem63a-/- mice after TNT surgery (n = 3–4; n.s., P >0.05, **P <0.01, ***P <0.001, two-way ANOVA). In C–H #P <0.05, ##P <0.01, ###P <0.001, baseline versus each time point, one-way ANOVA.

