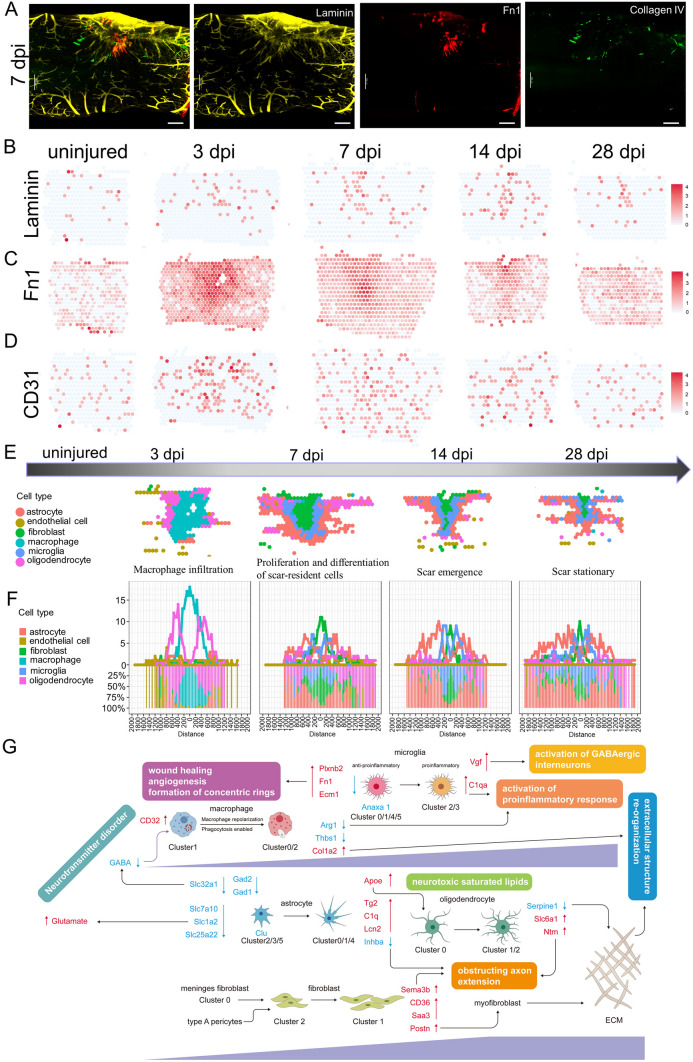
Fig. 10.
Visualization and interpretation of the scar with transparency and ST. A IF-stained 7-dpi scars for laminin (yellow), Fn1 (red), and collagen IV (green) showing the extent of the scar boundary (scale bars, 200 µm). B–D Spatial maps showing the expression of laminin (B) Fn1 (C), and CD31 (D) at different time points after injury. E ST showing the extent of the scar boundary of different cell types. F Quantification of the number and fraction of spots representing astrocytes, endothelial cells, fibroblasts, macrophages, microglia, and oligodendrocytes. G Summary of the changes in key genes and biological processes after SCI.

