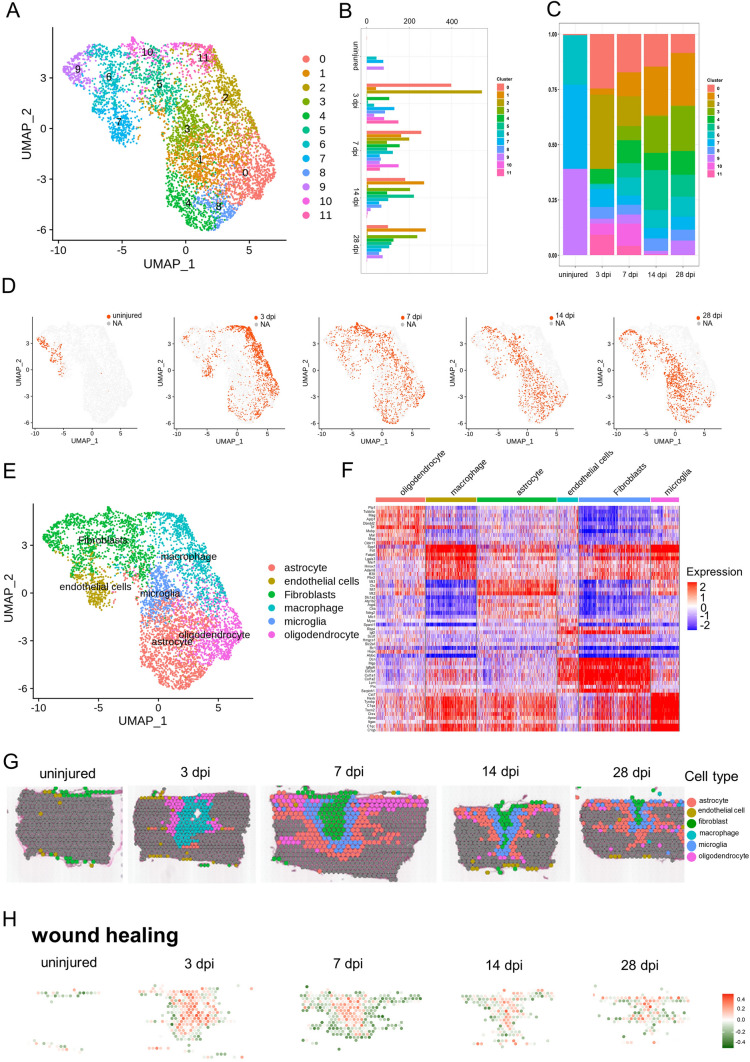
Fig. 2.
Cataloguing resident cells during glial scar maturation with ST. A UMAP spots showing the re-clustering analysis of cluster 2 cells and cluster 3 cells from four stages of scar maturation. B Histogram showing the number of spots in each subpopulation. C Bar plot showing the fraction of all spots comprising each subpopulation at different stages of scar maturation. D UMAP spots embedding overlay showing the distribution of spots at different time points after injury. E UMAP spots embedding overlay showing the six main cell clusters at different time points after injury. F Heat map showing the top 10 markers for the annotation of individual clusters shown as fraction of expression (color) of gene markers (columns). G Spatial maps showing the six main cell clusters at different time points after injury. H Spatial maps showing the GSVA scores of wound healing enriched in the six main cell clusters at different time points after injury.

