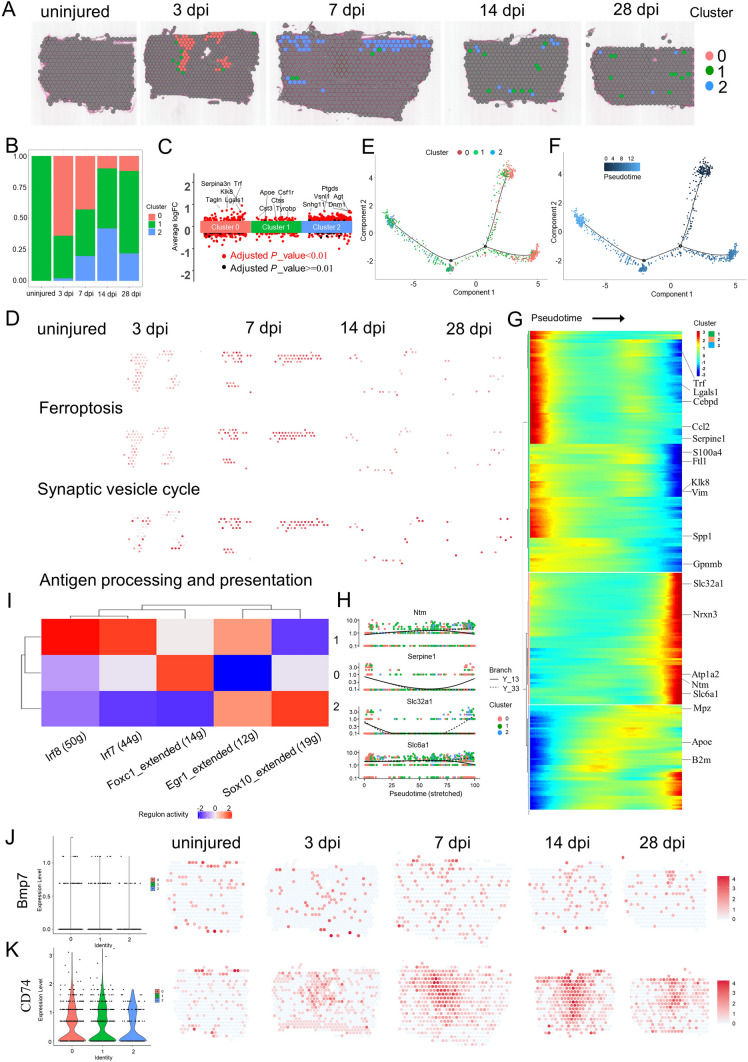
Fig. 8.
Phenotypic and functional heterogeneity of oligodendrocytes in the glial scar. A Spatial maps showing the distribution of 3 oligodendrocyte clusters in the glial scar at different time points after injury. B Bar plot showing the fraction of all spots comprising each subpopulation at different time points after injury. C Jitterplot showing the top 5 differentially expressed genes in each subpopulation. D Spatial maps showing the GSVA scores of ferroptosis pathway enrichment in cluster 0 cells, antigen processing and presentation pathway enrichment in cluster 1 cells, and synaptic vesicle cycle pathway enrichment in cluster 2 cells at different time points after injury. E, F Trajectory of oligodendrocytes in the glial scar. G Heat map showing the changes in gene expression along a spatial trajectory. H Expression of Ntm, Serpine1, Slc32a1, and Slc6a1 is correlated with pseudotime. I Heat map showing the enriched transcription factors by single-cell regulatory network inference and clustering analysis in different clusters after injury. J Violin plots and spatial maps showing the expression of Bmp7 at different time points after injury. K Violin plots and spatial maps showing the expression of CD74 at different time points after injury.

