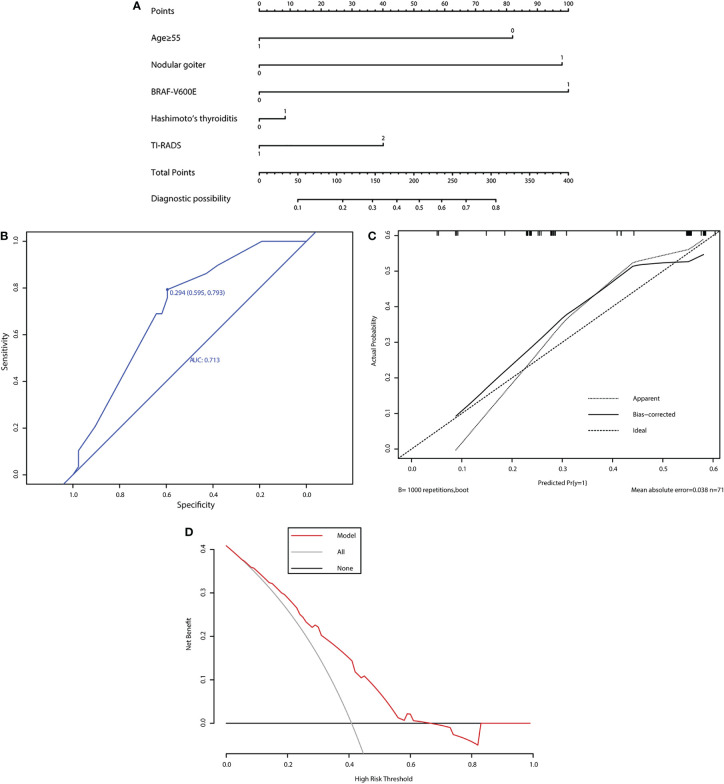
Figure 3.
Evaluation of the performance of the new prediction model. (A) Nomogram for predicting CLNM in PTC patients based on five risk factors. (B) The ROC curve and AUC of the nomogram. ROC, receiver operating characteristic. (C) Calibration plots of the nomogram for predicting CLNM. (D) The DCA method evaluated the performance of the model.

